Automotive
How U.S. Vehicle Production Has Shifted Over 45 Years
How U.S. Vehicle Production Has Shifted Over 45 Years
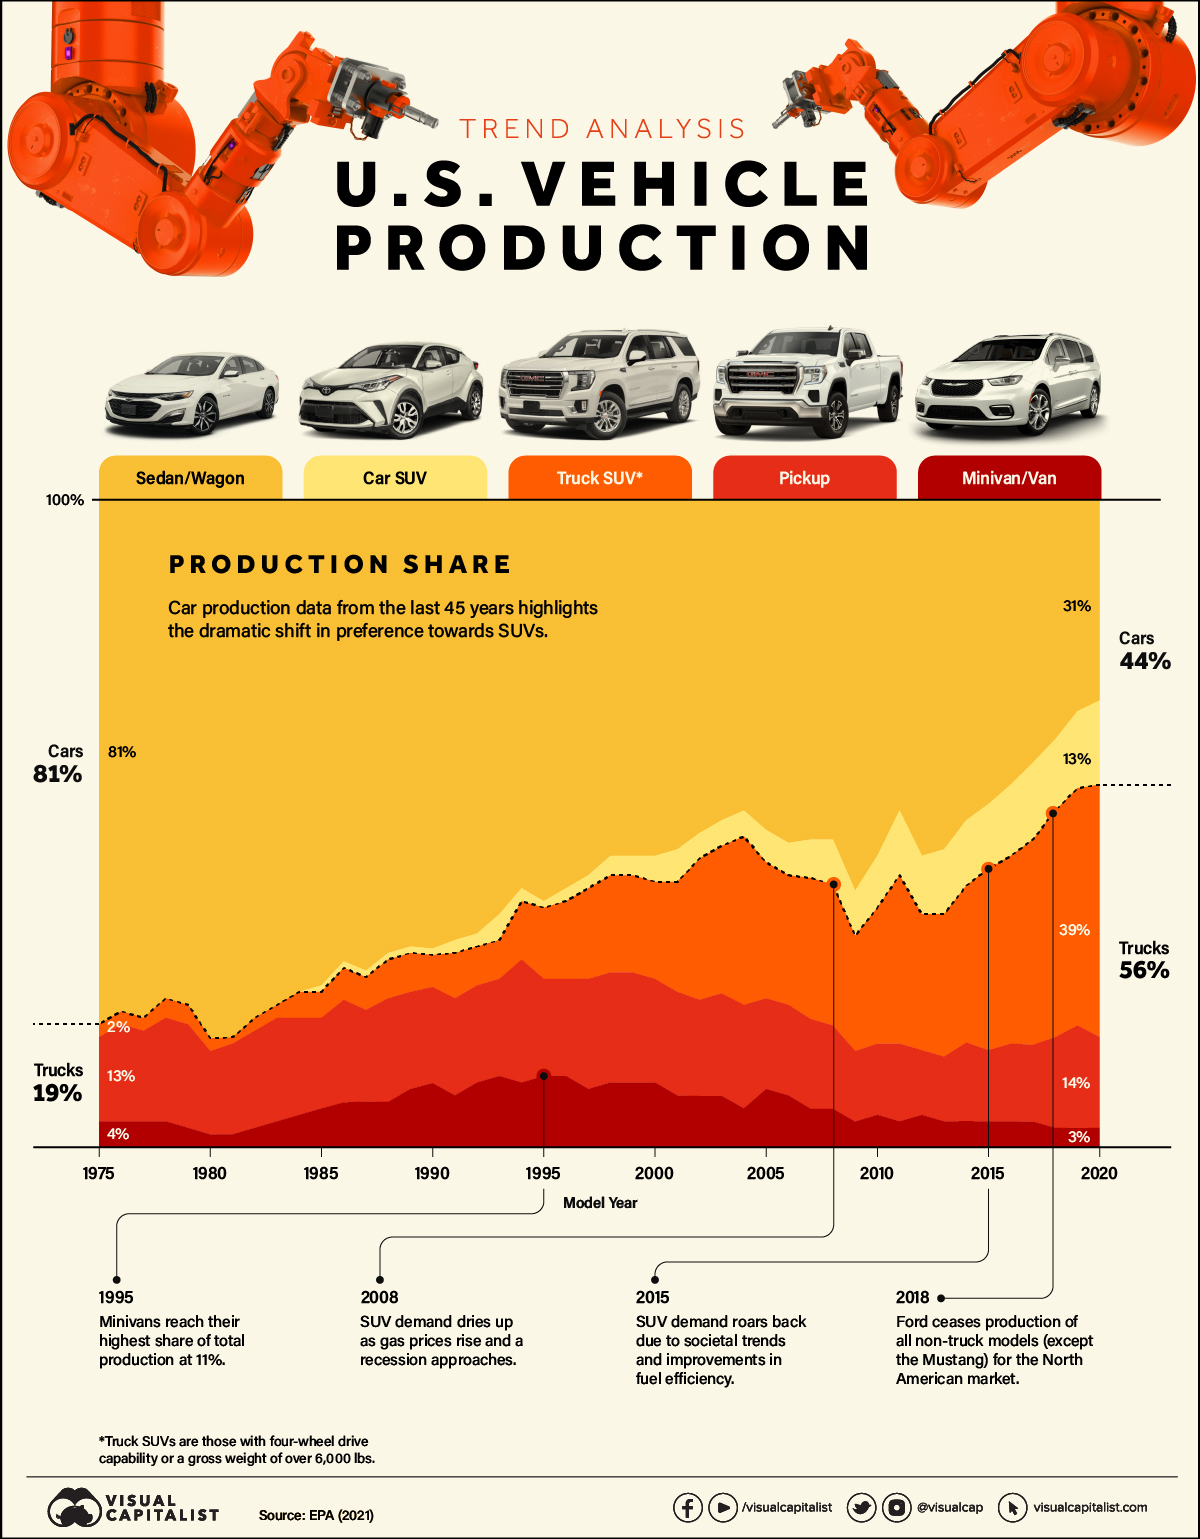
Over the last few decades, vehicle production in the U.S. has dramatically shifted, with SUVs emerging as the indisputable frontrunners.
Once perceived as vehicles solely for off-road capabilities and adventuring (hence the name sport utility vehicle), SUVs soon became a useful transportation alternative for large families. Shortly after, they became the top-selling models for many automakers.
The graphic above uses data on the annual production shares of different vehicle types from the U.S. Environmental Protection Agency (EPA) to explore the factors that have led to the surging popularity of SUVs.
U.S. Vehicle Production: The Rise of SUVs
As SUV production has evolved, they’ve started to blur the line between car and truck classes. The EPA classifies most two-wheel drive SUVs under 6,000 lbs as cars (car SUVs), while those with four-wheel drive or above 6,000 lbs are trucks (truck SUVs).
In the American market, sedans and wagons dominated production from before the 1970s and well into the 1990s. Combined with smaller car SUVs, cars accounted for more than half of U.S. vehicle production well into the 2010s.
But the rapid rise of heavier truck SUVs has shifted the landscape. Sedans and wagons dipped below 50% of market production for the first time in 2004. And by 2017, trucks (including truck SUVs, pickups, and minivans) have been the ones accounting for over half of new vehicle production.
| U.S. Production Share (%) | 1975 | 1980 | 1985 | 1990 | 1995 | 2000 | 2005 | 2010 | 2015 | 2020 |
|---|---|---|---|---|---|---|---|---|---|---|
| Sedan/Wagon | 81% | 84% | 75% | 70% | 62% | 55% | 51% | 55% | 47% | 31% |
| Car SUV | 0% | 0% | 1% | 1% | 1% | 4% | 5% | 8% | 10% | 13% |
| Truck SUV | 2% | 2% | 4% | 5% | 11% | 15% | 21% | 21% | 28% | 39% |
| Pickup | 13% | 13% | 14% | 15% | 15% | 16% | 14% | 11% | 11% | 14% |
| Minivan/Van | 4% | 2% | 6% | 10% | 11% | 10% | 9% | 5% | 4% | 3% |
The growth of SUVs can be partially linked to all-wheel drive systems that gained momentum in the 1980s, with the Audi Quattro winning three rallies in its rookie season of 1981.
During that same time, new SUV models started to gain popularity, like the 1984 Jeep Cherokee—considered the first modern SUV with four doors—and Land Rover’s Range Rover, which entered the North American market in 1987.
By melding the benefits of space, performance, and comfort into one vehicle, SUVs began competing with both vans and station wagons as the quintessential family car. In the 90s, affordable midsize models like the Ford Explorer, Subaru Legacy Outback, and Toyota RAV4 paved the way for more middle-class families to enter the SUV market.
However, SUV production has been prone to fluctuations. Demand first started dropping as gas prices rose in the lead-up to the 2008 recession, which further strained finances and caused families to opt for cheaper non-SUV models. This significantly hurt the American “Big Three” automotive producers (GM, Ford, and Chrysler) at the time, for which trucks and SUVs had become the primary market.
SUV Fuel Efficiency and Millennials
Driven by improvements in fuel efficiency and societal trends, SUV demand roared back over the last 10 years.
Automakers have implemented fuel-saving technologies, such as direct injection and turbocharging, and have used more lightweight materials in construction to further boost engine efficiency.
While fuel efficiency has improved across all types of vehicles over the last four decades, sedans and wagons climbed far earlier in miles per gallon (MPG) scores, while SUVs have only more recently started catching up.
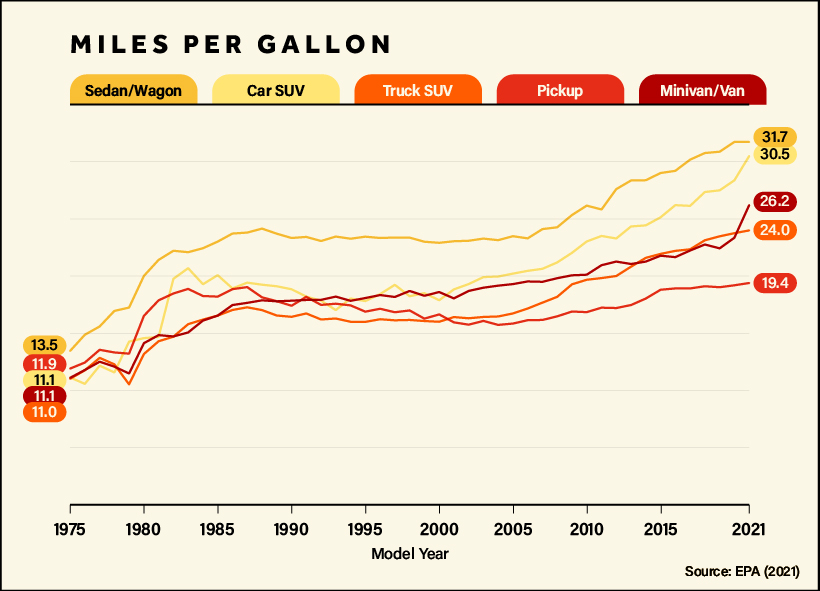
Since 2000, fuel efficiency for sedans and wagons improved by around 38%, while car SUVs saw a jump of 70% over the same time period, with both sitting at just over 30 MPG for 2021 models. Even larger truck SUVs, seen as the epitome of gas-guzzling vehicles, have become as efficient (in MPG terms) as sedans were in the 2000s.
Another factor influencing the market is the surprising entry of millennials, who now represent the majority of the population in the United States. Just a few years ago, automakers were fretting over millennials being a childless, car-less, city-dwelling group who cared little about buying cars or homes.
Fast forward to today—as millennials have aged and their wallets have gotten a little heavier, more of them are buying SUVs to drive to their suburban homes or just to fit their dogs.
SUVs are also benefiting from the shift to electric vehicles. In 2022, SUVs represented 46% of global car sales, and electric SUVs accounted for over half of global electric car sales.


Automotive
How People Get Around in America, Europe, and Asia
Examining how people get around using cars, public transit, and walking or biking, and the regional differences in usage.


How People Get Around in America, Europe, and Asia
This was originally posted on our Voronoi app. Download the app for free on iOS or Android and discover incredible data-driven charts from a variety of trusted sources.
This chart highlights the popularity of different transportation types in the Americas, Europe, and Asia, calculated by modal share.
Data for this article and visualization is sourced from ‘The ABC of Mobility’, a research paper by Rafael Prieto-Curiel (Complexity Science Hub) and Juan P. Ospina (EAFIT University), accessed through ScienceDirect.
The authors gathered their modal share data through travel surveys, which focused on the primary mode of transportation a person employs for each weekday trip. Information from 800 cities across 61 countries was collected for this study.
North American Car Culture Contrasts with the Rest of the World
In the U.S. and Canada, people heavily rely on cars to get around, no matter the size of the city. There are a few exceptions of course, such as New York, Toronto, and smaller college towns across the United States.
| Region | 🚗 Cars | 🚌 Public Transport | 🚶 Walking/Biking |
|---|---|---|---|
| North America* | 92% | 5% | 4% |
| Central America | 23% | 42% | 35% |
| South America | 29% | 40% | 31% |
| Northern Europe | 48% | 29% | 24% |
| Western Europe | 43% | 24% | 34% |
| Southern Europe | 50% | 24% | 25% |
| Eastern Europe | 35% | 40% | 25% |
| Southeastern Asia | 44% | 43% | 13% |
| Western Asia | 43% | 28% | 29% |
| Southern Asia | 22% | 39% | 39% |
| Eastern Asia | 19% | 46% | 35% |
| World | 51% | 26% | 22% |
Note: *Excluding Mexico. Percentages are rounded.
As a result, North America’s share of public transport and active mobility (walking and biking) is the lowest amongst all surveyed regions by a significant amount.
On the other hand, public transport reigns supreme in South and Central America as well as Southern and Eastern Asia. It ties with cars in Southeastern Asia, and is eclipsed by cars in Western Asia.
As outlined in the paper, Europe sees more city-level differences in transport popularity.
For example, Utrecht, Netherlands prefers walking and biking. People in Paris and London like using their extensive transit systems. And in Manchester and Rome, roughly two out of three journeys are by car.

-

 Maps2 weeks ago
Mapped: U.S. Immigrants by Region
-

 population1 week ago
Mapped: U.S. States By Number of Cities Over 250,000 Residents
-

 Brands1 week ago
Charted: How the Logos of Select Fashion Brands Have Evolved
-

 United States1 week ago
Mapped: Countries Where Recreational Cannabis is Legal
-

 War1 week ago
Visualized: Aircraft Carriers by Country
-

 Brands1 week ago
How Popular Snack Brand Logos Have Changed
-

 Mining2 weeks ago
Visualizing Copper Production by Country in 2023
-

 Misc2 weeks ago
Charted: How Americans Feel About Federal Government Agencies