Money
The Growing Auto Loan Problem Facing Young Americans
The Growing Auto Loan Problem Facing Young Americans
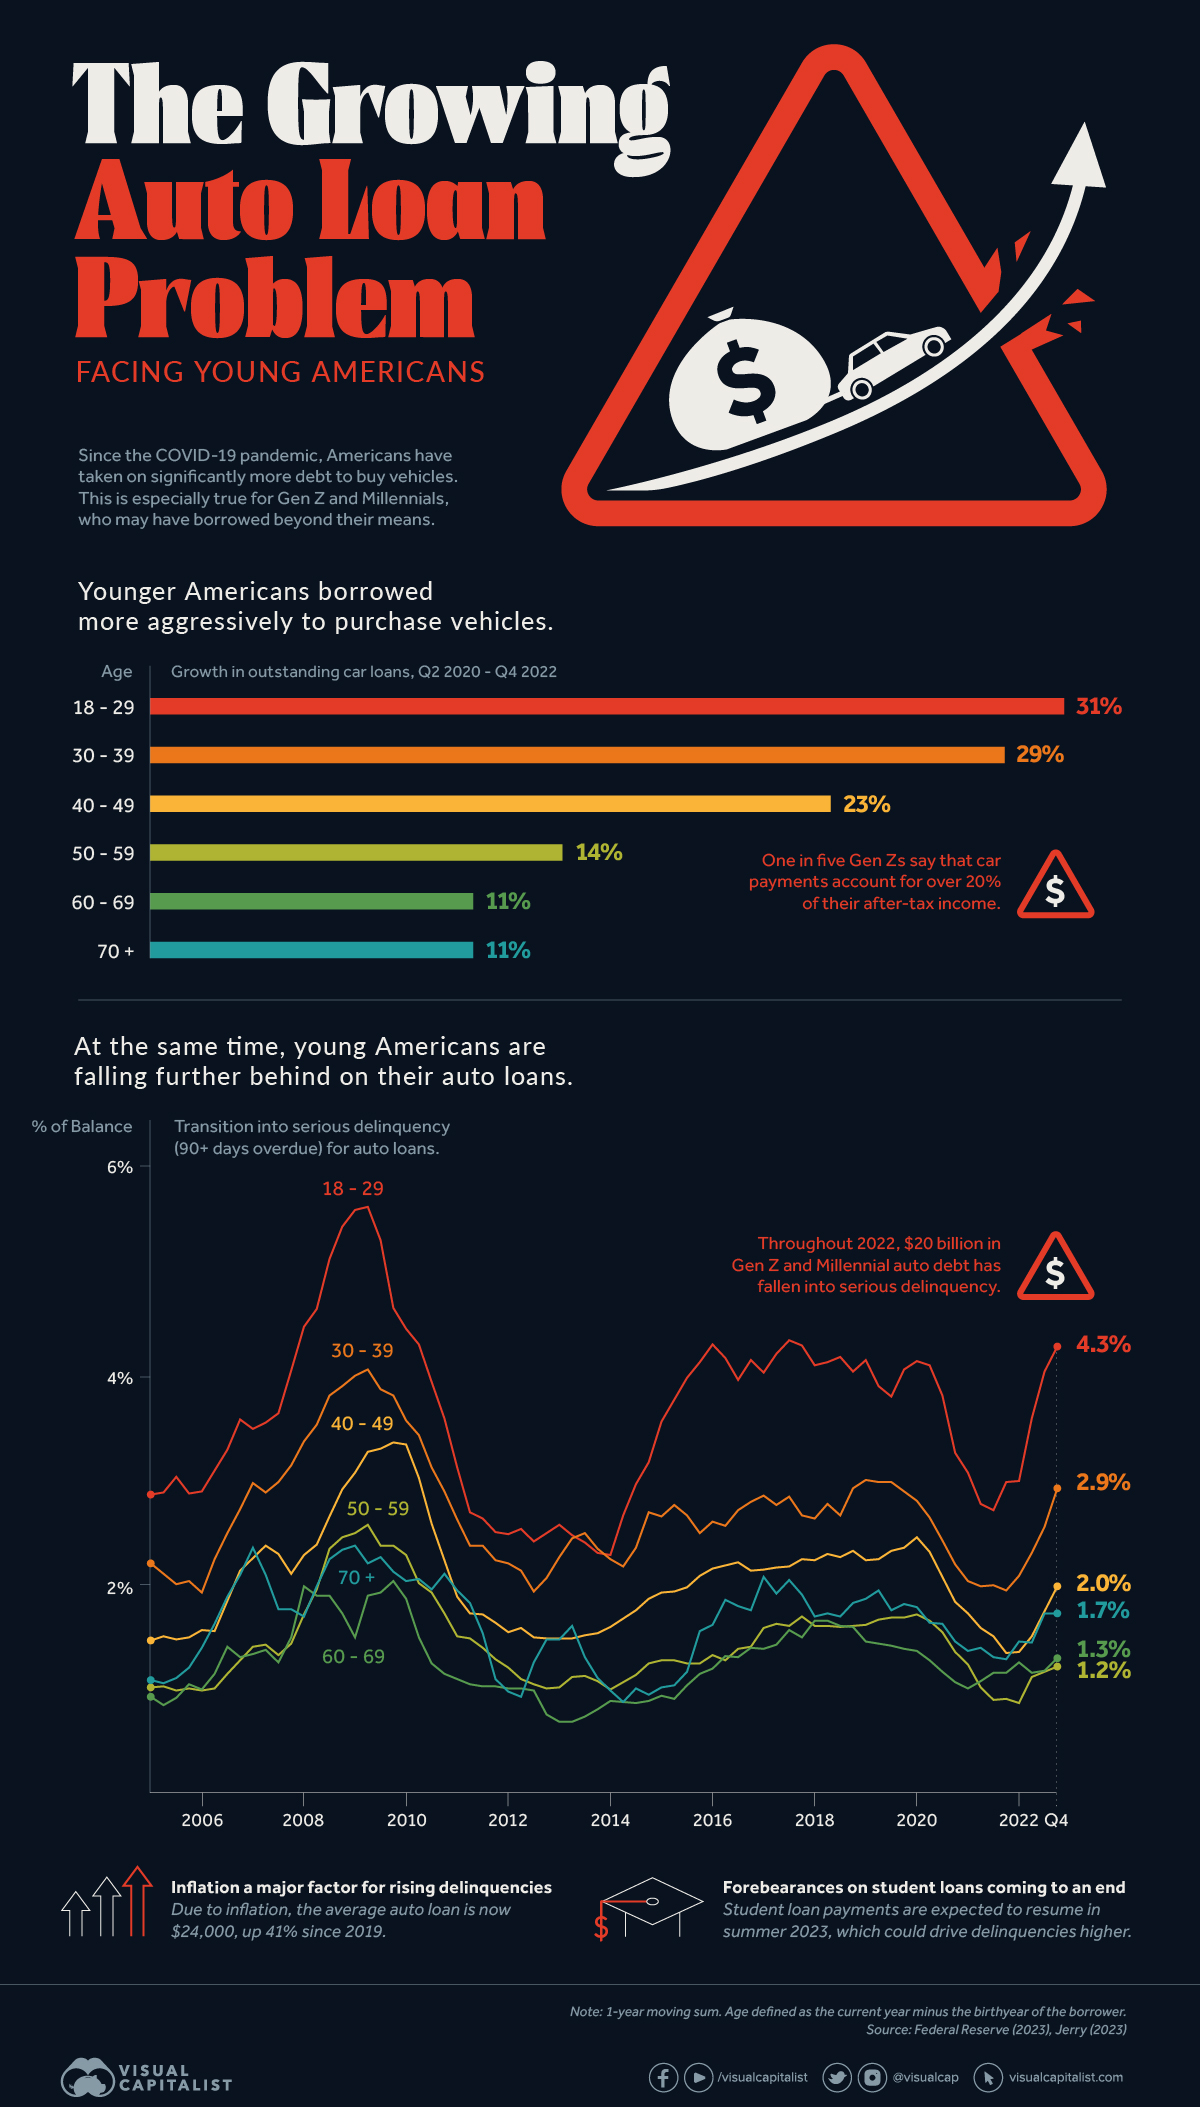
Since the COVID-19 pandemic, Americans have taken on significantly more debt to buy vehicles. This is especially true for Gen Z and Millennials, who the Federal Reserve believes may have borrowed beyond their means.
In this infographic, we’ve visualized data from the Fed’s most recent consumer debt update.
Aggressive Borrowing
The first chart in this graphic shows the growth in outstanding car loans between Q2 2020 (start of the pandemic) to Q4 2022 (latest available).
| Age | Growth in outstanding car loans |
|---|---|
| 18-29 | 31% |
| 30-39 | 29% |
| 40-49 | 23% |
| 50-59 | 14% |
| 60-69 | 11% |
| 70+ | 11% |
We can see that Americans under the age of 40 have grown their vehicle-related debt the most. It’s natural for Gen Z (ages 11-26) to have higher growth figures because many of them are buying their first car, but 31% is quite high relatively speaking.
Part of this can be attributed to today’s inflationary environment, which has pushed used car prices to new highs. Supply chain issues have also resulted in over 30% of new cars being sold above MSRP.
Because of these rising prices, the Fed reports that the average auto loan is now $24,000, up 41% from 2019’s value of $17,000.
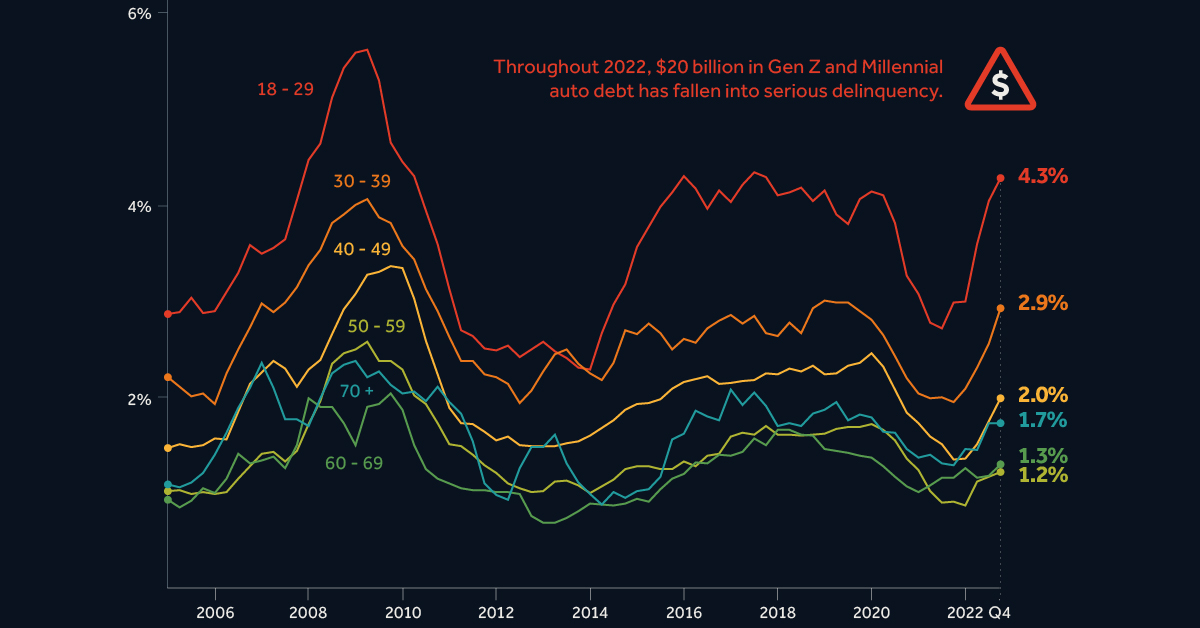
Spiking Delinquencies
Interest rates on auto loans are typically fixed, meaning many young Americans were able to take advantage of the low rates seen during the pandemic.
Despite this, one in five Gen Zs say that their car payments account for over 20% of their after-tax income.
Shown in the second chart of this infographic, the amount of auto debt transitioning into serious delinquency is much higher for Gen Z and Millennials. Throughout 2022, these generations saw $20 billion in auto debt fall 90+ days behind.
The outlook for these struggling borrowers is bleak. First there’s inflation, which has pushed up the prices of most consumer goods. This eats into their ability to make car payments.
Second is rising interest rates, which make credit card debt—another pain point for young borrowers—even more costly. Finally, there’s student loans, which are expected to resume in summer 2023. Payments on student debt have been suspended since the beginning of the COVID-19 pandemic.


Wealth
Visualizing the Tax Burden of Every U.S. State
Tax burden measures the percent of an individual’s income that is paid towards taxes. See where it’s the highest by state in this graphic.


Visualizing the Tax Burden of Every U.S. State
This was originally posted on our Voronoi app. Download the app for free on iOS or Android and discover incredible data-driven charts from a variety of trusted sources.
This map graphic visualizes the total tax burden in each U.S. state as of March 2024, based on figures compiled by WalletHub.
It’s important to understand that under this methodology, the tax burden measures the percent of an average person’s income that is paid towards state and local taxes. It considers property taxes, income taxes, and sales & excise tax.
Data and Methodology
The figures we used to create this graphic are listed in the table below.
| State | Total Tax Burden |
|---|---|
| New York | 12.0% |
| Hawaii | 11.8% |
| Vermont | 11.1% |
| Maine | 10.7% |
| California | 10.4% |
| Connecticut | 10.1% |
| Minnesota | 10.0% |
| Illinois | 9.7% |
| New Jersey | 9.5% |
| Rhode Island | 9.4% |
| Utah | 9.4% |
| Kansas | 9.3% |
| Maryland | 9.3% |
| Iowa | 9.2% |
| Nebraska | 9.2% |
| Ohio | 8.9% |
| Indiana | 8.9% |
| Arkansas | 8.8% |
| Mississippi | 8.8% |
| Massachusetts | 8.6% |
| Virginia | 8.5% |
| West Virginia | 8.5% |
| Oregon | 8.4% |
| Colorado | 8.4% |
| Pennsylvania | 8.4% |
| Wisconsin | 8.3% |
| Louisiana | 8.3% |
| Kentucky | 8.3% |
| Washington | 8.0% |
| New Mexico | 8.0% |
| Michigan | 8.0% |
| North Carolina | 7.9% |
| Idaho | 7.9% |
| Arizona | 7.8% |
| Missouri | 7.8% |
| Georgia | 7.7% |
| Texas | 7.6% |
| Alabama | 7.5% |
| Montana | 7.5% |
| South Carolina | 7.5% |
| Nevada | 7.4% |
| Oklahoma | 7.0% |
| North Dakota | 6.8% |
| South Dakota | 6.4% |
| Delaware | 6.4% |
| Tennessee | 6.1% |
| Florida | 6.1% |
| Wyoming | 5.7% |
| New Hampshire | 5.6% |
| Alaska | 4.9% |
From this data we can see that New York has the highest total tax burden. Residents in this state will pay, on average, 12% of their income to state and local governments.
Breaking this down into its three components, the average New Yorker pays 4.6% of their income on income taxes, 4.4% on property taxes, and 3% in sales & excise taxes.
At the other end of the spectrum, Alaska has the lowest tax burden of any state, equaling 4.9% of income. This is partly due to the fact that Alaskans do not pay state income tax.
Hate Paying Taxes?
In addition to Alaska, there are several other U.S. states that don’t charge income taxes. These are: Florida, Nevada, South Dakota, Tennessee, Texas, Washington, and Wyoming.
It’s also worth noting that New Hampshire does not have a regular income tax, but does charge a flat 4% on interest and dividend income according to the Tax Foundation.
Learn More About Taxation From Visual Capitalist
If you enjoyed this post, be sure to check out this graphic which ranks the countries with the lowest corporate tax rates, from 1980 to today.

-

 Markets6 days ago
Mapped: Europe’s GDP Per Capita, by Country
-

 Energy2 weeks ago
Mapped: The Age of Energy Projects in Interconnection Queues, by State
-

 Mining2 weeks ago
Visualizing Global Gold Production in 2023
-

 Markets2 weeks ago
Visualized: Interest Rate Forecasts for Advanced Economies
-

 Economy2 weeks ago
The Most Valuable Companies in Major EU Economies
-

 Markets1 week ago
The World’s Fastest Growing Emerging Markets (2024-2029 Forecast)
-

 Markets1 week ago
Visualizing Global Inflation Forecasts (2024-2026)
-

 Misc1 week ago
Charted: What Southeast Asia Thinks About China & the U.S.