Markets
Charted: The Rise and Fall of WeWork


Charted: The Rise and Fall of WeWork
Despite its recommitment to core business fundamentals in the last few years, WeWork’s management—which saw a shakeup in May 2023 when CEO Sandeep Mathrani departed—is setting off a signal flare about the company’s future.
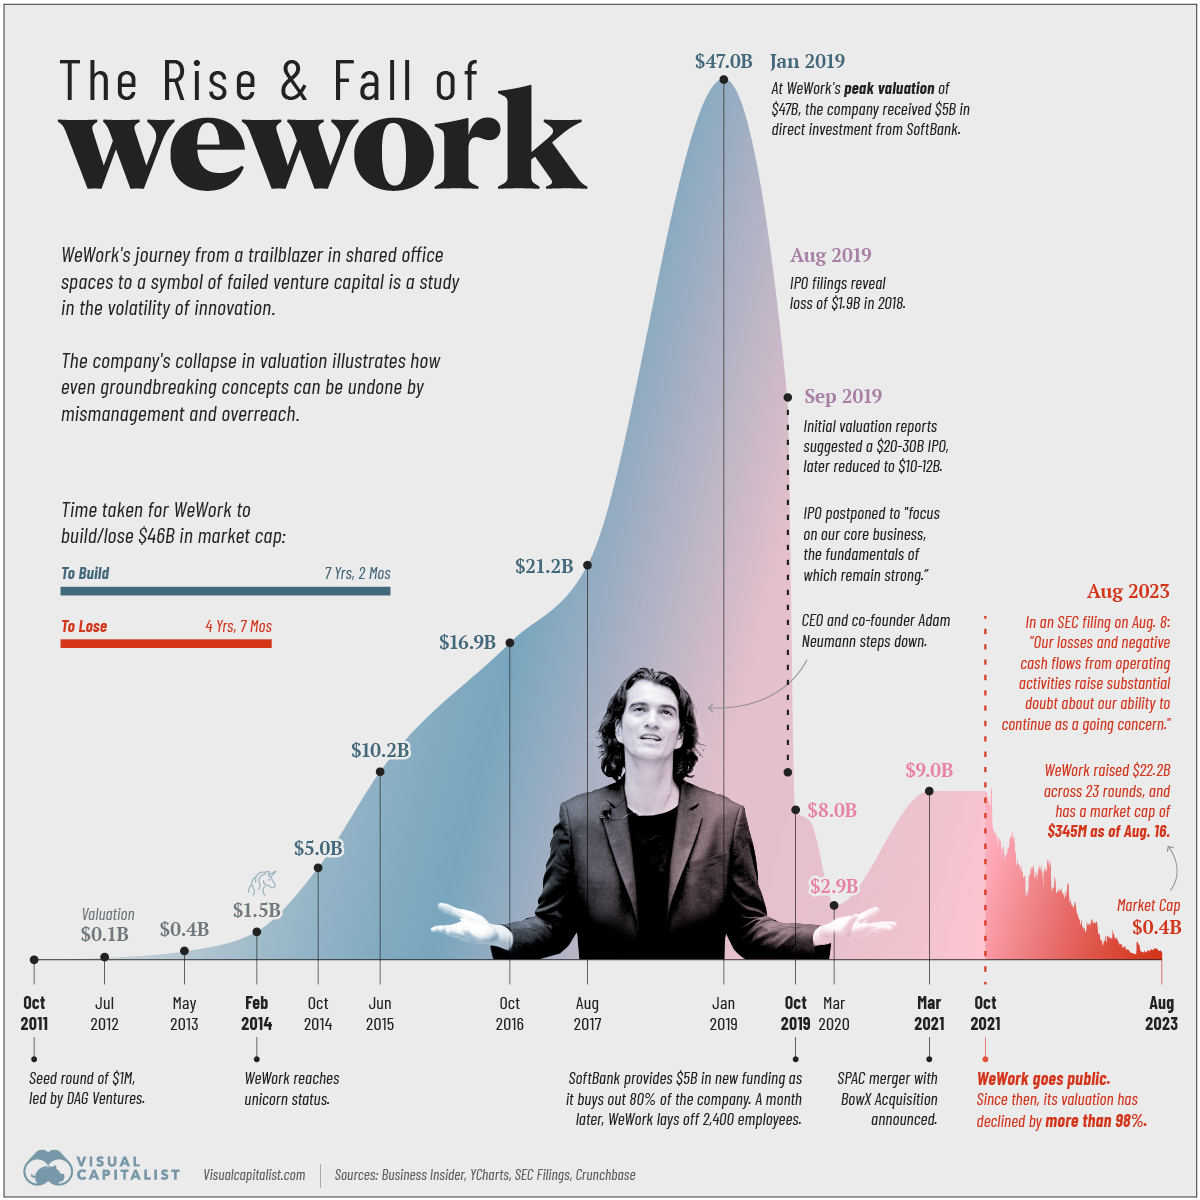
“Our losses and negative cash flows from operating activities raise substantial doubt about our ability to continue as a going concern.” — WeWork, SEC filing, August 8th, 2023.
But how did the once-poster child of Silicon Valley end up seeing its valuation collapse more than 99% from its peak?
Pulling together data from Business Insider, YCharts, SEC Filings, and Crunchbase we follow the rise and fall of WeWork since 2011.
The Rise of WeWork: 2010–2019
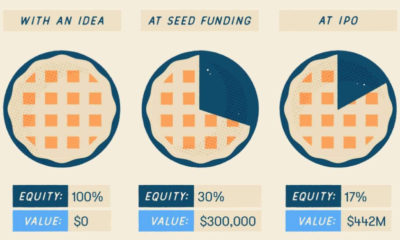
WeWork was founded in 2010 by Adam Neumann and Miguel McKelvey with the primary objective of providing shared workspaces catered to freelancers, startups, and companies seeking “flexible office solutions.”
The business model, which rested on renting space from developers long-term, renovating and parceling the property, and subsequently leasing it out to short-term clients, thrived in a decade of low interest rates.
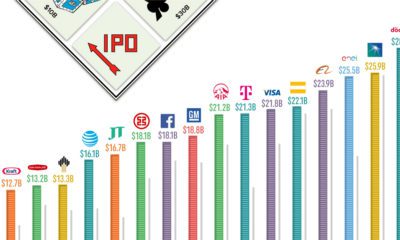
Its valuation surpassed $1 billion in 2014, earning the coveted “unicorn” status. In 2017, SoftBank Group made the first of its total $18.5 billion investment in the company. Two years later, WeWork hit a peak valuation of $47 billion with SoftBank’s continued investments, raising expectations for an imminent IPO.
| Date | WeWork's Valuation |
|---|---|
| October, 2011 | n/a |
| July, 2012 | $97 million |
| May, 2013 | $440 million |
| February, 2014 | $1.5 billion |
| October, 2014 | $5.0 billion |
| June, 2015 | $10.2 billion |
| October, 2016 | $16.9 billion |
| August, 2017 | $21.2 billion |
| January, 2019 | $47.0 billion |
| August, 2019 | $20-30 billion |
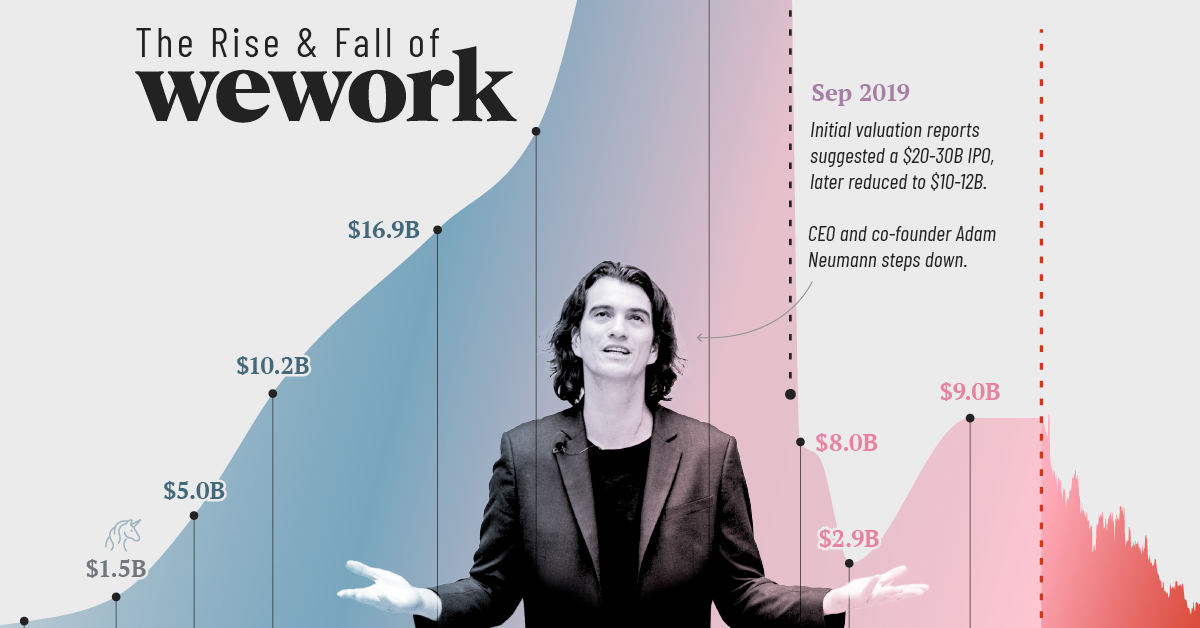
| September, 2019 | $10-12 billion |
| October, 2019 | $8.0 billion |
| December, 2019 | $7.3 billion* |
| March, 2020 | $2.9 billion* |
| March, 2021 | $9.0 billion |
| October, 2021 | $9.0 billion |
| August, 2023 | $0.4 billion |
Footnote: *SoftBank valuation is based on discounted cash flow method.
The Fall of WeWork: 2019–2023
Intensive scrutiny fueled by the impending IPO raised several questions for the company. These included concerns around Neumann’s leadership style, excessive spending, creative accounting, and conflicts of interest leading to Neumann’s resignation and delay of the IPO.
In October 2019, SoftBank Group acquired 80% of the company with $5 billion of additional funding. A month later WeWork laid off 2,400 employees, nearly one-fifth of its workforce.
Real estate veteran Sandeep Mathrani was made CEO in 2020, tasked with turning the company around by eliminating recurring costs and restructuring its debt.
That same year the COVID-19 pandemic forced a significant shift to remote work, causing a decline in office space demand. WeWork’s business model, focused on shared physical spaces, faced a substantial challenge.
In 2021, WeWork went public through a SPAC merger, aiming to regain investor trust. The listing reflected a revised strategy focusing on key markets, cost optimization, and a pivot toward catering to larger corporate clients with hybrid work needs.
Over the past two years, its market capitalization as a publicly-traded company has plummeted from $9 billion to under half a billion dollars. WeWork disclosed $11.4 billion in net losses from 2020 through to June 30th, 2023 in their recent SEC filing.
What Happened to WeWork?
Aside from the trials and tribulations of former CEO Adam Neumann, the company’s sustainability itself has been questioned several times over the past decade. In 2019, the Guardian summarized the criticism succinctly by saying, the company was “renting long and subleasing short,” which left it “exposed to risk.”
Post-pandemic, the proliferation of work-from-home policies, along with the rapid rise in global interest rates in the last year—which can reduce cash flows for the commercial real estate industry—have magnified those risks.
WeWork is now battling an environment of excess supply, softer demand, increased competition and macroeconomic volatility, according to interim CEO David Tolley.
“It was foolish of me to invest in WeWork. I was wrong.” — Masayoshi Son, SoftBank Group founder.
The New York Times says that WeWork has more than 18 million square feet of rentable office space in the U.S. and Canada alone and that its failure could have a “sizable impact” on the commercial real estate industry.
At the same time, the Times notes that reporting the “substantial doubt” on continued business operations might help the company buy time with lenders to seek additional capital through issuance of debt, equity, or the sale of assets.


Maps
Mapped: The 10 U.S. States With the Lowest Real GDP Growth
In this graphic, we show where real GDP lagged the most across America in 2023 as high interest rates weighed on state economies.


The Top 10 U.S. States, by Lowest Real GDP Growth
This was originally posted on our Voronoi app. Download the app for free on iOS or Android and discover incredible data-driven charts from a variety of trusted sources.
While the U.S. economy defied expectations in 2023, posting 2.5% in real GDP growth, several states lagged behind.
Last year, oil-producing states led the pack in terms of real GDP growth across America, while the lowest growth was seen in states that were more sensitive to the impact of high interest rates, particularly due to slowdowns in the manufacturing and finance sectors.
This graphic shows the 10 states with the least robust real GDP growth in 2023, based on data from the Bureau of Economic Analysis.
Weakest State Economies in 2023
Below, we show the states with the slowest economic activity in inflation-adjusted terms, using chained 2017 dollars:
| Rank | State | Real GDP Growth 2023 YoY | Real GDP 2023 |
|---|---|---|---|
| 1 | Delaware | -1.2% | $74B |
| 2 | Wisconsin | +0.2% | $337B |
| 3 | New York | +0.7% | $1.8T |
| 4 | Missississippi | +0.7% | $115B |
| 5 | Georgia | +0.8% | $661B |
| 6 | Minnesota | +1.2% | $384B |
| 7 | New Hampshire | +1.2% | $91B |
| 8 | Ohio | +1.2% | $698B |
| 9 | Iowa | +1.3% | $200B |
| 10 | Illinois | +1.3% | $876B |
| U.S. | +2.5% | $22.4T |
Delaware witnessed the slowest growth in the country, with real GDP growth of -1.2% over the year as a sluggish finance and insurance sector dampened the state’s economy.
Like Delaware, the Midwestern state of Wisconsin also experienced declines across the finance and insurance sector, in addition to steep drops in the agriculture and manufacturing industries.
America’s third-biggest economy, New York, grew just 0.7% in 2023, falling far below the U.S. average. High interest rates took a toll on key sectors, with notable slowdowns in the construction and manufacturing sectors. In addition, falling home prices and a weaker job market contributed to slower economic growth.
Meanwhile, Georgia experienced the fifth-lowest real GDP growth rate. In March 2024, Rivian paused plans to build a $5 billion EV factory in Georgia, which was set to be one of the biggest economic development initiatives in the state in history.
These delays are likely to exacerbate setbacks for the state, however, both Kia and Hyundai have made significant investments in the EV industry, which could help boost Georgia’s manufacturing sector looking ahead.

-

 Technology1 week ago
Countries With the Highest Rates of Crypto Ownership
-

 Mining6 days ago
Visualizing Copper Production by Country in 2023
-

 Politics7 days ago
Charted: How Americans Feel About Federal Government Agencies
-

 Healthcare1 week ago
Which Countries Have the Highest Infant Mortality Rates?
-

 Demographics1 week ago
Mapped: U.S. Immigrants by Region
-

 Economy1 week ago
Mapped: Southeast Asia’s GDP Per Capita, by Country
-

 Automotive1 week ago
How People Get Around in America, Europe, and Asia
-

 Personal Finance1 week ago
Visualizing the Tax Burden of Every U.S. State