Top 10 Countries Most in Debt to the IMF
Ranked: The Top 6 Economies by Share of Global GDP (1980-2024)
Mapped: Europe’s GDP Per Capita, by Country
The Growth of a $1,000 Equity Investment, by Stock Market
Mapped: The Most Valuable Company in Each Southeast Asian Country
Countries With the Highest Rates of Crypto Ownership
Mapped: The Number of AI Startups By Country
All of the Grants Given by the U.S. CHIPS Act
Visualizing AI Patents by Country
How Tech Logos Have Evolved Over Time
Visualizing America’s Average Retirement Savings, by Age
Visualizing the Tax Burden of Every U.S. State
Charted: What Frustrates Americans About the Tax System
Ranked: The Top 20 Countries in Debt to China
Mapped: Countries Where Recreational Cannabis is Legal
Which Countries Have the Highest Infant Mortality Rates?
Life Expectancy by Region (1950-2050F)
What Causes Preventable Child Deaths?
The Cost of an EpiPen in Major Markets
Who’s Building the Most Solar Energy?
Mapped: The Age of Energy Projects in Interconnection Queues, by State
Ranked: The Top 10 EV Battery Manufacturers in 2023
The World’s Biggest Nuclear Energy Producers
The World’s Biggest Oil Producers in 2023
Mapped: U.S. States By Number of Cities Over 250,000 Residents
Mapped: U.S. Immigrants by Region
Mapped: Southeast Asia’s GDP Per Capita, by Country
The Largest Earthquakes in the New York Area (1970-2024)
The Biggest Salt Producing Countries in 2023
Visualizing Copper Production by Country in 2023
Where the World’s Aluminum is Smelted, by Country
Visualizing Global Gold Production in 2023
How People Get Around in America, Europe, and Asia
The Carbon Footprint of Major Travel Methods
Ranking the Top 15 Countries by Carbon Tax Revenue
Ranked: The Countries With the Most Air Pollution in 2023
Top Countries By Forest Growth Since 2001
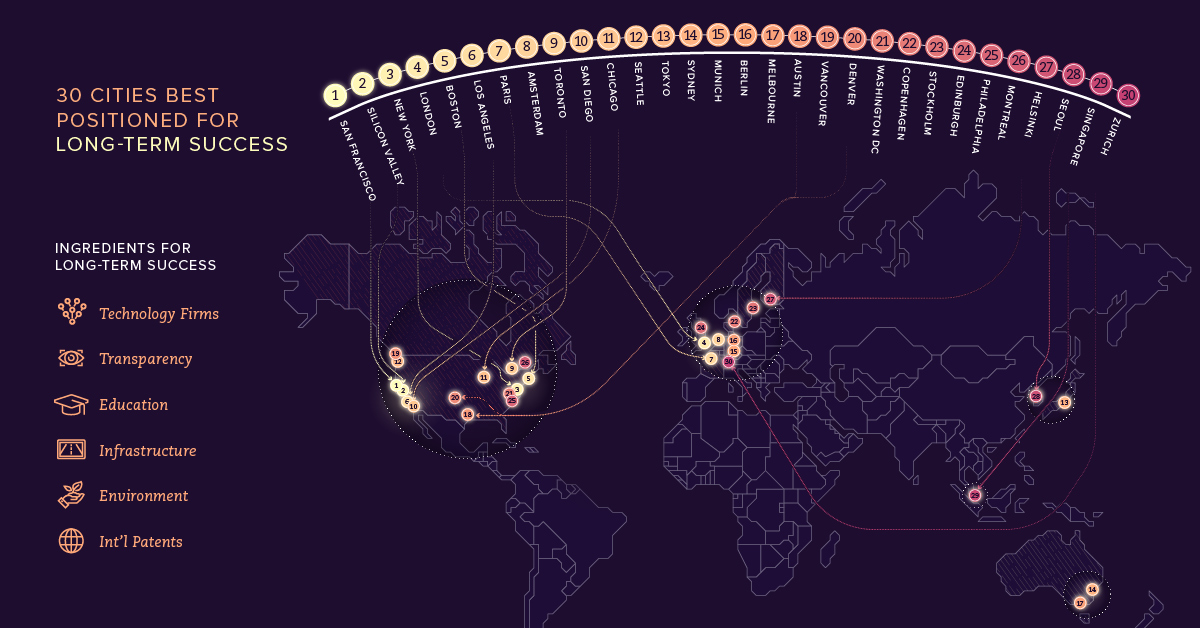
Which cities will be able to attract top-end talent and foster future innovation in order to stay atop a changing and increasingly digital global economy?
This infographic analyzes over 30 years of stock market performance to identify the best and worst months for gains.
The markets in 2022 were characterized by a lot more pain than gain. That said, there were winners to be found, even during a turbulent year
Millennials continue to puzzle the general population, but this infographic has 29 facts that may help you see millennials differently.
The U.S. market is up 9.5% so far in 2017, but individual sectors are all over the place. We look at four of the best -...
We visualized the results of a LinkedIn study on the best U.S. companies to work for in 2024.
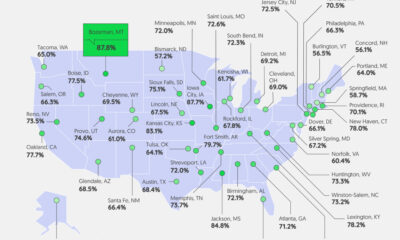
Good pay can help manage first-job worries. We visualize how geography affects entry-level pay across the U.S.
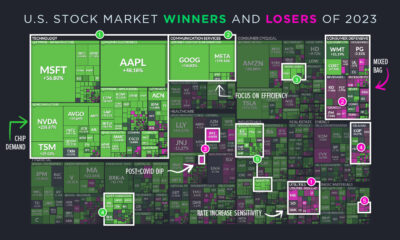
Here are the best performing sectors of 2023—and the ones that fell behind—in a year defined by AI, high interest rates, and resilience.
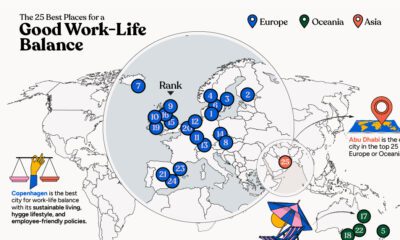
In this infographic, we explore which cities around the world excel in prioritizing work–life balance.
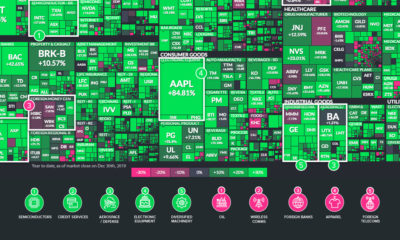
The U.S. stock market had a banner year, but some sectors were notable outliers. Here are the ones that outperformed (and underperformed) in 2019.


 Creator Program