Which Retailers Operate in the Most Countries?
Mapped: The 10 U.S. States With the Lowest Real GDP Growth
Ranked: The World’s 50 Largest Private Equity Firms
Top 10 Countries Most in Debt to the IMF
Ranked: The Top 6 Economies by Share of Global GDP (1980-2024)
Ranked: The Top Startup Cities Around the World
Visualizing the 5 Most Common Cybersecurity Mistakes
Countries With the Highest Rates of Crypto Ownership
Mapped: The Number of AI Startups By Country
All of the Grants Given by the U.S. CHIPS Act
Visualizing America’s Average Retirement Savings, by Age
Visualizing the Tax Burden of Every U.S. State
Charted: What Frustrates Americans About the Tax System
Ranked: The Top 20 Countries in Debt to China
Mapped: Countries Where Recreational Cannabis is Legal
Which Countries Have the Highest Infant Mortality Rates?
Life Expectancy by Region (1950-2050F)
What Causes Preventable Child Deaths?
The Cost of an EpiPen in Major Markets
Who’s Building the Most Solar Energy?
Mapped: The Age of Energy Projects in Interconnection Queues, by State
Ranked: The Top 10 EV Battery Manufacturers in 2023
The World’s Biggest Nuclear Energy Producers
The World’s Biggest Oil Producers in 2023
Mapped: Indian States with Cities Over 1 Million People
Mapped: The Top Export in Each EU Country
Mapped: The Top Exports in Asian Countries
Mapped: U.S. States By Number of Cities Over 250,000 Residents
The Biggest Salt Producing Countries in 2023
Visualizing Copper Production by Country in 2023
Where the World’s Aluminum is Smelted, by Country
Visualizing Global Gold Production in 2023
How People Get Around in America, Europe, and Asia
The Carbon Footprint of Major Travel Methods
Ranking the Top 15 Countries by Carbon Tax Revenue
Ranked: The Countries With the Most Air Pollution in 2023
Top Countries By Forest Growth Since 2001
This chart looks at some of the common items that are sold on the Dark Web, and how much they sold for on average in 2022.
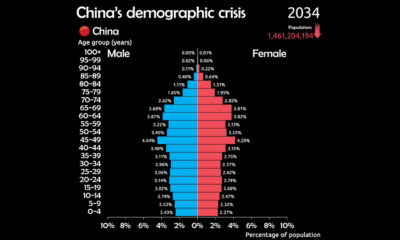
See why China is facing a demographic crisis in this animated chart.
New VC+ subscribers get access to a special gift: a roundup of our best ever visualizations around population.
The history of Europe is breathtakingly complex, but this animation helps makes sense of 2,400 years of change on the European map.
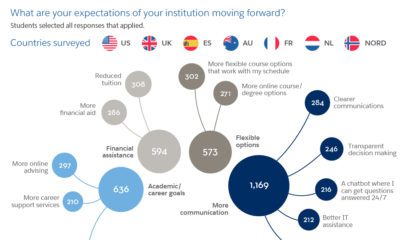
Higher education is facing a new wave of change during the pandemic. What are the new priorities of 2,200 students and staff worldwide?
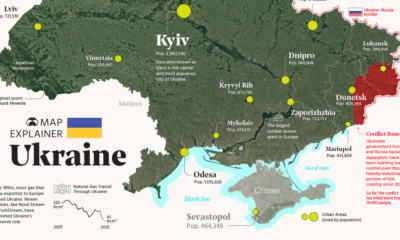
Ukraine has made the headlines due to the ongoing tensions with Russia. In this map infographic, we examine Ukraine from a structural point of view.
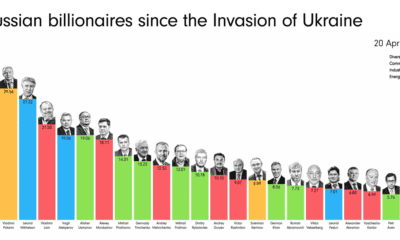
How have Russian billionaires fared since Russia's invasion of Ukraine? This animation tracks the wealth of 22 Russian billionaires.
In 2022, the global net assets of mutual fund and ETF providers totaled $38 trillion. This chart shows the industry's biggest brands.
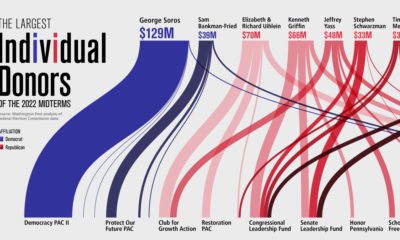
A record-smashing $9 billion has been raised for the 2022 midterm elections. See who the top 10 donors are in this graphic.
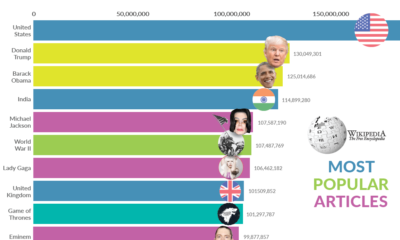
Millions flock to Wikipedia every day to satisfy their curiosity on every imaginable topic. What have been the most popular Wikipedia pages over time?


 Creator Program