China
Animated Chart: China’s Aging Population (1950-2100)
Article/Editing:
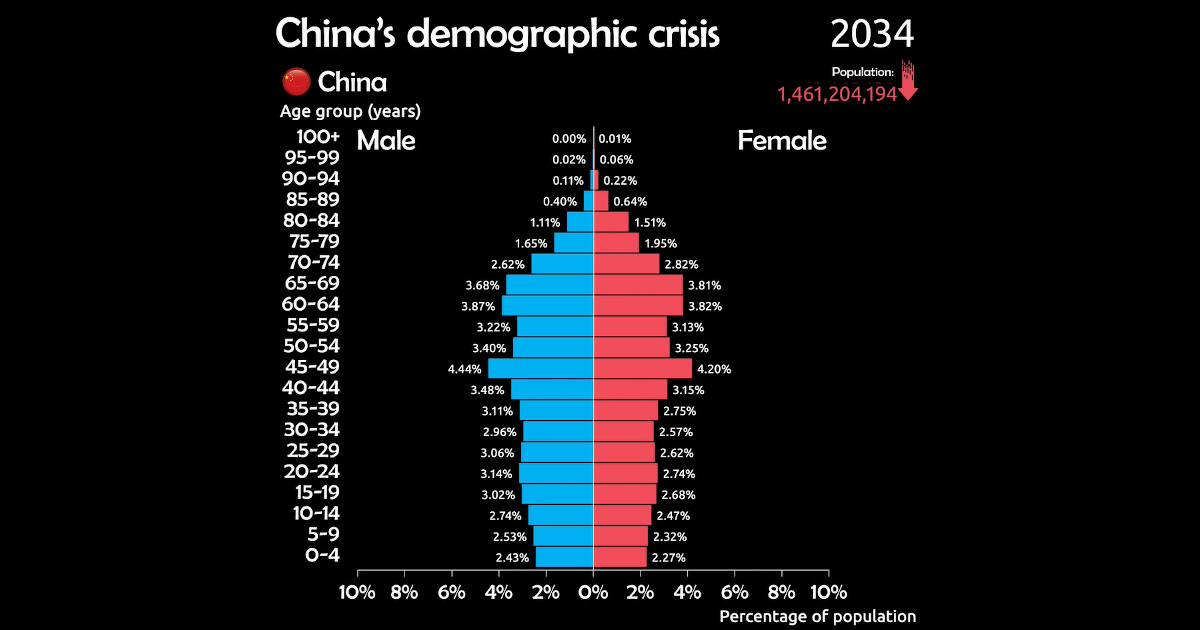
China’s Aging Population Problem
The one-child policy defined China’s demographic transition for over three decades.
But to combat an aging population and declining birthrates, the government scrapped the policy for a new two-child policy in 2016. Despite this massive change, China still faces a growing demographic crisis.
The above animated population pyramid from James Eagle looks at the distribution of China’s population by age group since 1950, with projections up to the year 2100.
How the One-Child Policy Created a Gender Imbalance
Until 2016, the Chinese government strictly enforced the one-child policy since 1979 with hefty fines for any breach of rules. According to the government, the policy reduced 400 million births over the years.
However, it also led to sex-selective abortions due to a deep-rooted cultural preference for boys. As a result, China’s gender balance tilted, with a sex ratio of 111 males to 100 females in the population aging from 0 to 4 years old in 2020.
Often termed “the missing women of China”, this shortage of women is expected to worsen over time. According to the U.N.’s World Population Prospects, China is projected to have around 244 million fewer women than men in 2050.
Additionally, the country faces another impending consequence of the one-child policy—a rapidly aging population.
Why China’s Population is Aging
In 2020, China’s fertility rate—the number of children a woman is expected to have over her lifetime—stood at 1.3.
Generally, fertility rates drop as economies develop. However, China’s fertility rate is now lower than that of the U.S. (1.64 in 2020) and on par with countries like Japan and Italy, both of which are facing aging populations. Consequently, fewer newborns are entering the population, while many in the workforce approach retirement.
Most Chinese workers retire by age 60. Here’s how China’s retirement-age population is expected to shape up by the year 2100:
| Year | 60+ Population | % of Total Population |
|---|---|---|
| 1980 | 74,899,385 | 7.5% |
| 2000 | 129,460,648 | 10.0% |
| 2021 | 258,371,810 | 17.9% |
| 2050 | 485,489,066 | 34.6% |
| 2070 | 454,270,458 | 36.1% |
| 2100 | 402,780,972 | 37.8% |
In 2021, people aged 60 and over made up nearly one-fifth of the Chinese population. As the country’s population begins declining around 2030, over 30% of all Chinese people are expected to be in this age group.
China’s aging population threatens long-term economic growth as its workforce shrinks and low fertility rates result in fewer newborns that would later enter the working-age population. Fewer working people means lower overall consumption, a higher burden on elderly care, and slowing economic growth.
So, how will China respond to the oncoming crisis?
The Three-child Policy
According to the 2020 national census, Chinese mothers gave birth to 12 million children in 2020—the lowest number of births since 1949.
In response to these results, the government passed a new law allowing each couple to have up to three children. Despite the change, the high cost of raising a child may deter couples from having a third child.
It remains to be seen how the three-child policy helps combat China’s demographic crisis and which other policies the government chooses to deploy.

This article was published as a part of Visual Capitalist's Creator Program, which features data-driven visuals from some of our favorite Creators around the world.


Markets
China’s Real Estate Crisis, Shown in Two Charts
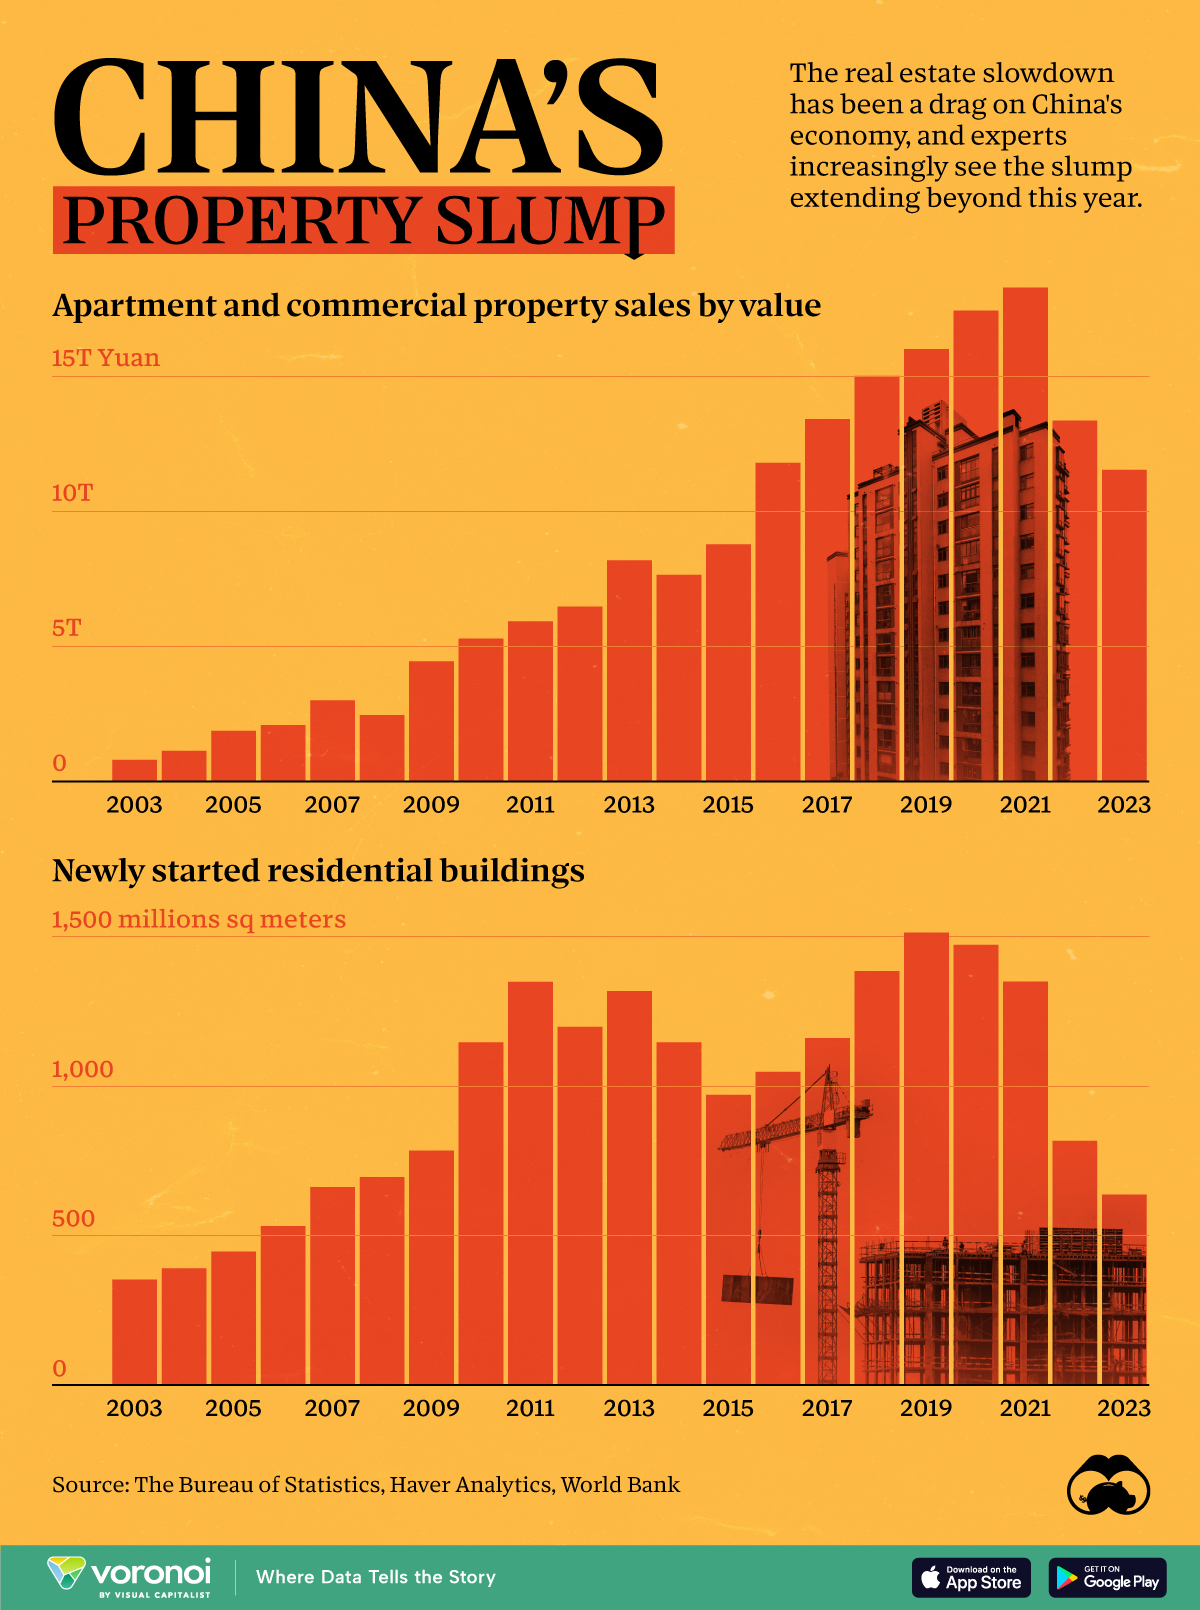
These charts show China’s real estate boom in the 21st century and the subsequent slowdown since 2022.
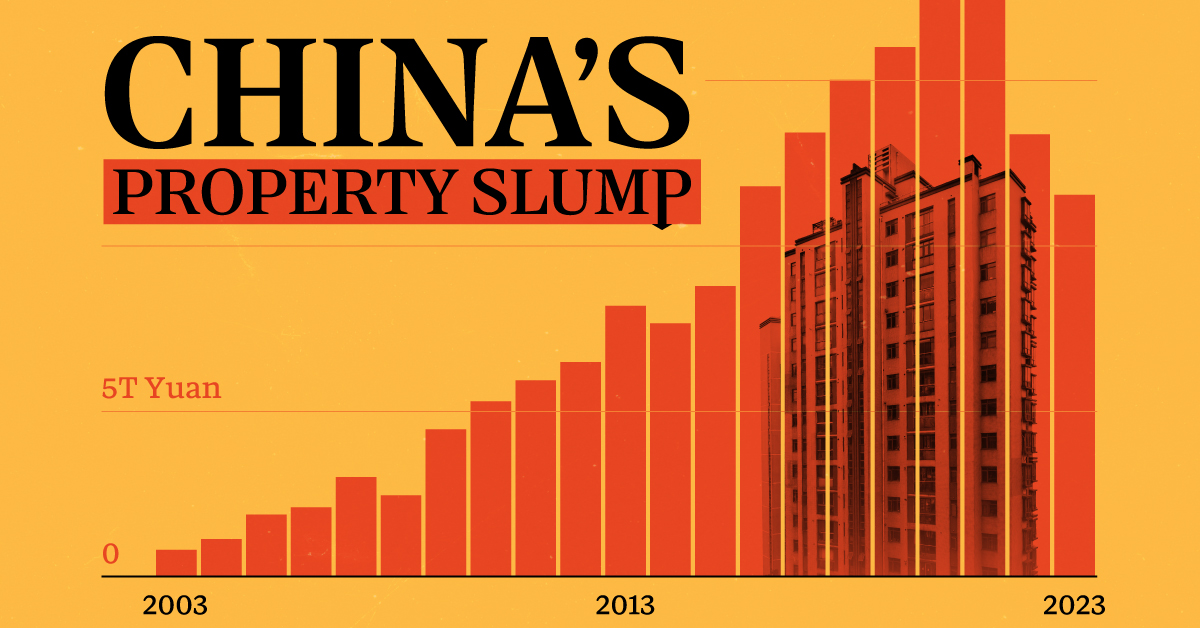
Visualizing China’s Real Estate Boom and Crisis
This was originally posted on our Voronoi app. Download the app for free on iOS or Android and discover incredible data-driven charts from a variety of trusted sources.
Evergrande—once China’s largest real estate developer—was forced to liquidate on January 28th. It was yet another strike against the country’s now fledgling real estate market, adding to a growing list of China’s economic worries.
In the charts above we show two annual metrics related to China’s real estate crisis from 2003 to 2023. The first looks at apartment and commercial property sales using Burreau of Statistics data from Bloomberg, and the second examines new housing starts using data from the World Bank.
Things to Know About China’s Property Slump
Property sales by value in China climbed pretty steadily from less than ¥1 trillion RMB in 2003 to over ¥15 trillion in 2021, but have since dropped to under ¥12 trillion in 2023.
This was the case across both residential and commercial sales. In China’s residential market specifically, new home sales dropped 6% in 2023, with secondhand home prices declining in major cities.
And on the development side, new residential developments have fallen 58% from 1,515 million m² in 2019 to 637 million m² in 2023.
| Year | New Residential Building Developments (million sq meters) |
|---|---|
| 2023 | 637.4 |
| 2022 | 817.3 |
| 2021 | 1,350.2 |
| 2020 | 1,473.4 |
| 2019 | 1,514.5 |
| 2018 | 1,385.4 |
| 2017 | 1,160.9 |
| 2016 | 1,047.8 |
| 2015 | 970.8 |
| 2014 | 1,146.4 |
| 2013 | 1,318.5 |
| 2012 | 1,199.1 |
| 2011 | 1,349.4 |
| 2010 | 1,147.2 |
| 2009 | 784.9 |
| 2008 | 695.4 |
| 2007 | 662.3 |
| 2006 | 531.8 |
| 2005 | 446.5 |
| 2004 | 390.0 |
| 2003 | 352.4 |
| 2002 | 276.5 |
Here are a few more things to know about the ongoing real estate crisis in China:
- Developer Defaults: Real estate firms faced $125 billion in bond defaults between 2020 and 2023.
- Economic Impact: The property sector’s slump has dragged down China’s economy, leading to layoffs and financial instability.
- Getting Creative: Municipalities, many of which rely on land sales as a key source of income, have been introducing “old-for-new” support measures meant to stimulate new home purchases.
Experts predict a prolonged downturn, with many people souring on Chinese investments, but exactly how things will develop after Evergrande’s collapse is unclear.

-

 Real Estate2 weeks ago
Visualizing America’s Shortage of Affordable Homes
-

 Technology1 week ago
Ranked: Semiconductor Companies by Industry Revenue Share
-

 Money1 week ago
Which States Have the Highest Minimum Wage in America?
-

 Real Estate1 week ago
Ranked: The Most Valuable Housing Markets in America
-

 Business2 weeks ago
Charted: Big Four Market Share by S&P 500 Audits
-

 AI2 weeks ago
The Stock Performance of U.S. Chipmakers So Far in 2024
-

 Misc2 weeks ago
Almost Every EV Stock is Down After Q1 2024
-

 Money2 weeks ago
Where Does One U.S. Tax Dollar Go?