Mapped: The 10 U.S. States With the Lowest Real GDP Growth
Ranked: The World’s 50 Largest Private Equity Firms
Top 10 Countries Most in Debt to the IMF
Ranked: The Top 6 Economies by Share of Global GDP (1980-2024)
Mapped: Europe’s GDP Per Capita, by Country
Countries With the Highest Rates of Crypto Ownership
Mapped: The Number of AI Startups By Country
All of the Grants Given by the U.S. CHIPS Act
Visualizing AI Patents by Country
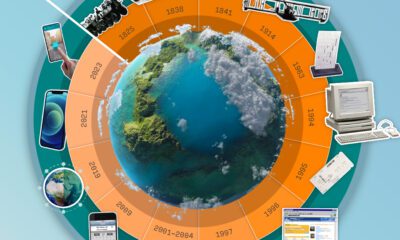
How Tech Logos Have Evolved Over Time
Visualizing America’s Average Retirement Savings, by Age
Visualizing the Tax Burden of Every U.S. State
Charted: What Frustrates Americans About the Tax System
Ranked: The Top 20 Countries in Debt to China
Mapped: Countries Where Recreational Cannabis is Legal
Which Countries Have the Highest Infant Mortality Rates?
Life Expectancy by Region (1950-2050F)
What Causes Preventable Child Deaths?
The Cost of an EpiPen in Major Markets
Who’s Building the Most Solar Energy?
Mapped: The Age of Energy Projects in Interconnection Queues, by State
Ranked: The Top 10 EV Battery Manufacturers in 2023
The World’s Biggest Nuclear Energy Producers
The World’s Biggest Oil Producers in 2023
Mapped: The Top Exports in Asian Countries
Mapped: U.S. States By Number of Cities Over 250,000 Residents
Mapped: U.S. Immigrants by Region
The Biggest Salt Producing Countries in 2023
Visualizing Copper Production by Country in 2023
Where the World’s Aluminum is Smelted, by Country
Visualizing Global Gold Production in 2023
How People Get Around in America, Europe, and Asia
The Carbon Footprint of Major Travel Methods
Ranking the Top 15 Countries by Carbon Tax Revenue
Ranked: The Countries With the Most Air Pollution in 2023
Top Countries By Forest Growth Since 2001
Fueled by powerful social and technological megatrends, travel & tourism has grown exponentially and in 2022 made up 7.6% of global GDP.
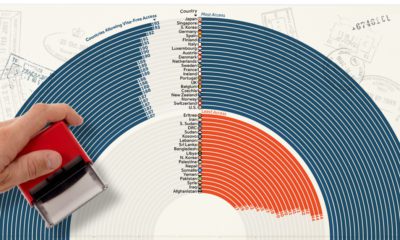
How strong is your passport? This ranking showcases the most and least powerful passports based on their ease of access to countries globally.
In this visualization, we rank the top 50 websites that receive the most internet traffic, from Google to CNN.
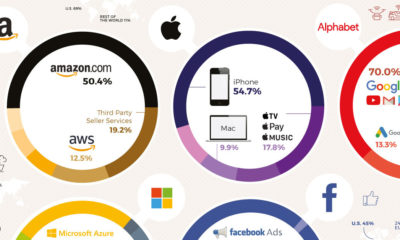
The big five tech companies generate almost $900 billion in revenues combined, more than the GDP of four of the G20 nations. Here's how they earn...
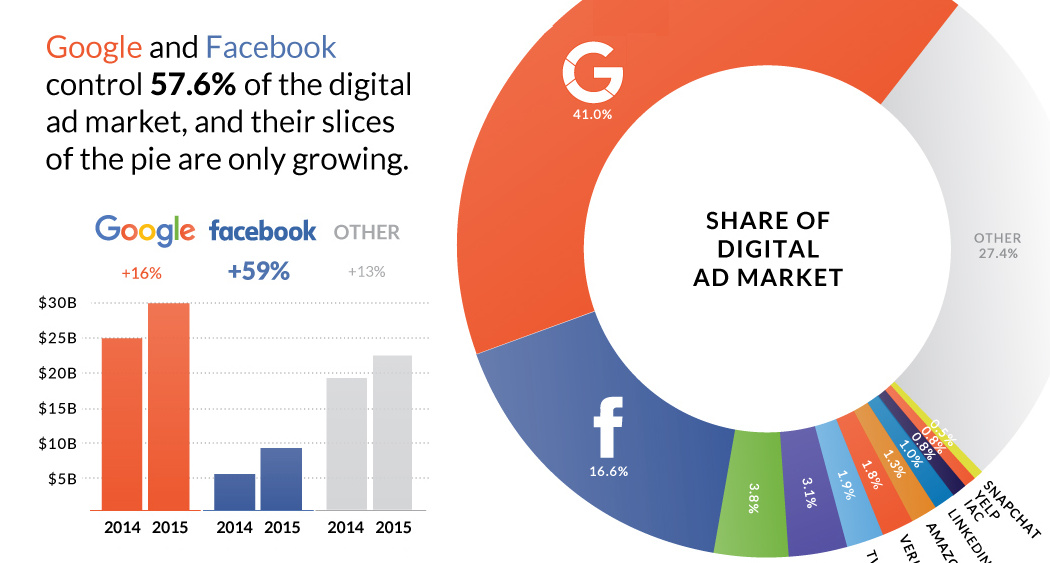
Nearly $0.60 of every $1.00 spent on digital advertising goes to Google and Facebook.
Nearly 6,000 satellites circle our tiny planet. About 60% are space junk, 40% are operational—and hundreds more are launched every year.
Which companies spend the most on traditional TV advertising? From pharmaceutical giants to big tech firms, we show the top spenders in 2023.
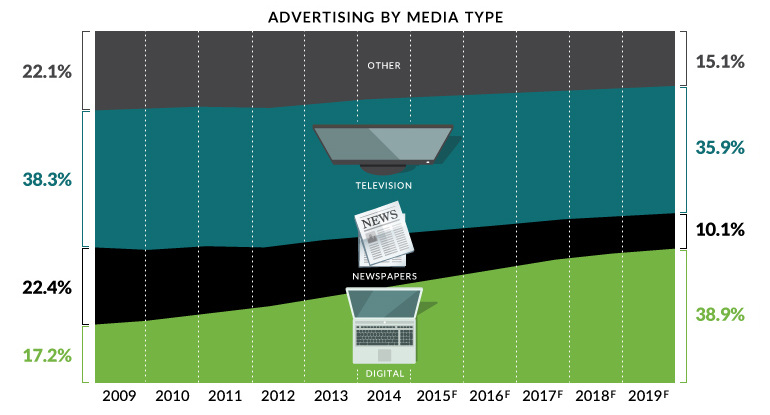
Digital media will be the largest advertising channel globally by 2019 - even bigger than television. This chart covers the death of traditional media.
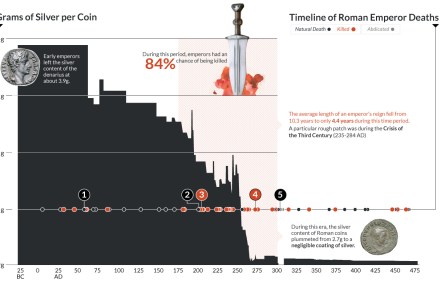
This data visualization plots the causes of death of Roman Emperors against the content of silver coins.
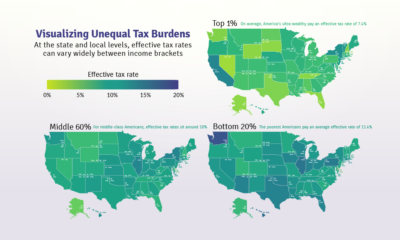
Poor families pay a higher share of their income towards state and local taxes than wealthy families. These maps show the inequitable tax burdens.