Mapped: The 10 U.S. States With the Lowest Real GDP Growth
Ranked: The World’s 50 Largest Private Equity Firms
Top 10 Countries Most in Debt to the IMF
Ranked: The Top 6 Economies by Share of Global GDP (1980-2024)
Mapped: Europe’s GDP Per Capita, by Country
Countries With the Highest Rates of Crypto Ownership
Mapped: The Number of AI Startups By Country
All of the Grants Given by the U.S. CHIPS Act
Visualizing AI Patents by Country
How Tech Logos Have Evolved Over Time
Visualizing America’s Average Retirement Savings, by Age
Visualizing the Tax Burden of Every U.S. State
Charted: What Frustrates Americans About the Tax System
Ranked: The Top 20 Countries in Debt to China
Mapped: Countries Where Recreational Cannabis is Legal
Which Countries Have the Highest Infant Mortality Rates?
Life Expectancy by Region (1950-2050F)
What Causes Preventable Child Deaths?
The Cost of an EpiPen in Major Markets
Who’s Building the Most Solar Energy?
Mapped: The Age of Energy Projects in Interconnection Queues, by State
Ranked: The Top 10 EV Battery Manufacturers in 2023
The World’s Biggest Nuclear Energy Producers
The World’s Biggest Oil Producers in 2023
Mapped: The Top Exports in Asian Countries
Mapped: U.S. States By Number of Cities Over 250,000 Residents
Mapped: U.S. Immigrants by Region
The Biggest Salt Producing Countries in 2023
Visualizing Copper Production by Country in 2023
Where the World’s Aluminum is Smelted, by Country
Visualizing Global Gold Production in 2023
How People Get Around in America, Europe, and Asia
The Carbon Footprint of Major Travel Methods
Ranking the Top 15 Countries by Carbon Tax Revenue
Ranked: The Countries With the Most Air Pollution in 2023
Top Countries By Forest Growth Since 2001
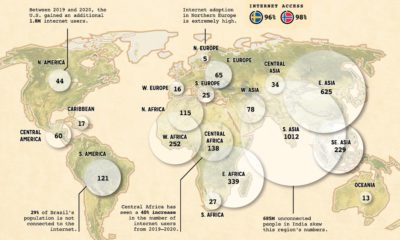
When it comes to worldwide internet use, which regions are the most disconnected? And which regions have the most opportunity for growth?
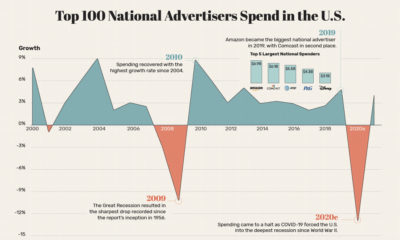
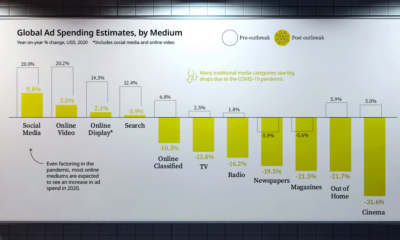
This graphic visualizes the fluctuations in advertising spend in the U.S., along with its brutal decline of 13% as a result of COVID-19.
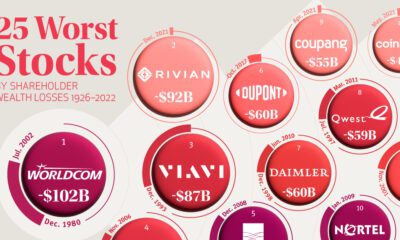
Among publicly-listed U.S. companies, the 25 worst stocks have lost shareholders a collective $1.2 trillion since 1926.
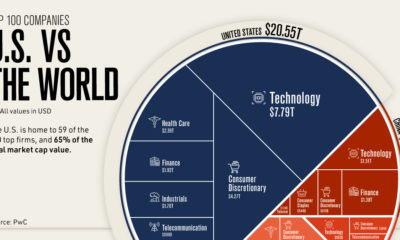
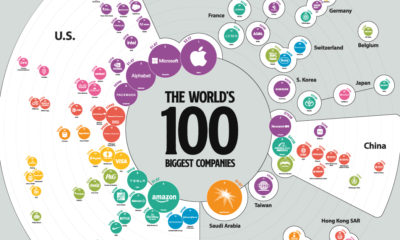
Where are the top 100 companies of the world located? We highlight the U.S. share of the top companies by market capitalization .
The 100 biggest companies in the world were worth a record-breaking $31.7 trillion as of the end of Q1, up 48% year-over-year.
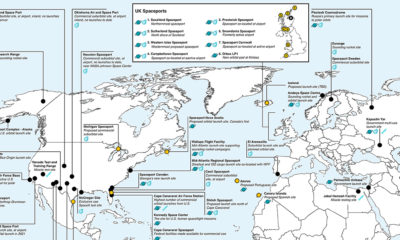
This map is a comprehensive look at both existing and proposed spaceports and missile launching locations around the world.
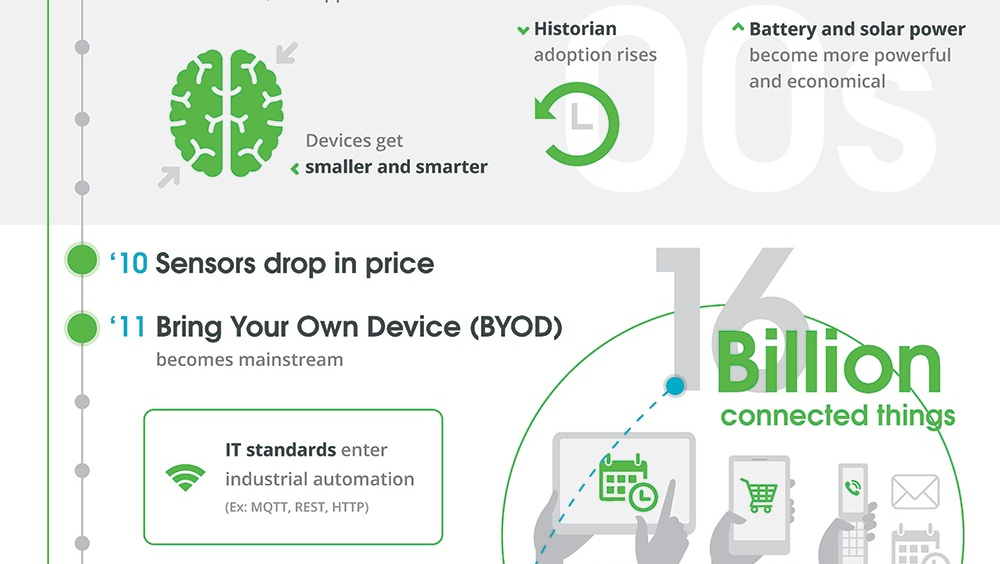
A timeline of innovations that led to today's Industrial Internet of Things (IIoT), which will have a $14.2 tn impact on the global economy by 2030.
Global advertising spending is estimated to see $50 billion decline across various mediums and industries as a result of COVID-19.
This in-depth infographic provides a practical guide on how anyone can increase privacy on their browser, social media networks, and mobile device.
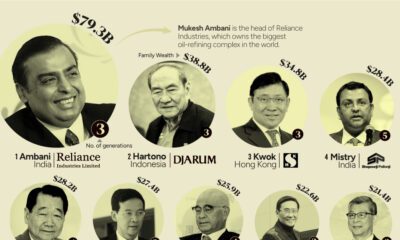
This graphic shows the 15 richest families in Asia. From energy to banking, these dynasties have built fortunes across many sectors.