Mapped: The 10 U.S. States With the Lowest Real GDP Growth
Ranked: The World’s 50 Largest Private Equity Firms
Top 10 Countries Most in Debt to the IMF
Ranked: The Top 6 Economies by Share of Global GDP (1980-2024)
Mapped: Europe’s GDP Per Capita, by Country
Countries With the Highest Rates of Crypto Ownership
Mapped: The Number of AI Startups By Country
All of the Grants Given by the U.S. CHIPS Act
Visualizing AI Patents by Country
How Tech Logos Have Evolved Over Time
Visualizing America’s Average Retirement Savings, by Age
Visualizing the Tax Burden of Every U.S. State
Charted: What Frustrates Americans About the Tax System
Ranked: The Top 20 Countries in Debt to China
Mapped: Countries Where Recreational Cannabis is Legal
Which Countries Have the Highest Infant Mortality Rates?
Life Expectancy by Region (1950-2050F)
What Causes Preventable Child Deaths?
The Cost of an EpiPen in Major Markets
Who’s Building the Most Solar Energy?
Mapped: The Age of Energy Projects in Interconnection Queues, by State
Ranked: The Top 10 EV Battery Manufacturers in 2023
The World’s Biggest Nuclear Energy Producers
The World’s Biggest Oil Producers in 2023
Mapped: The Top Exports in Asian Countries
Mapped: U.S. States By Number of Cities Over 250,000 Residents
Mapped: U.S. Immigrants by Region
The Biggest Salt Producing Countries in 2023
Visualizing Copper Production by Country in 2023
Where the World’s Aluminum is Smelted, by Country
Visualizing Global Gold Production in 2023
How People Get Around in America, Europe, and Asia
The Carbon Footprint of Major Travel Methods
Ranking the Top 15 Countries by Carbon Tax Revenue
Ranked: The Countries With the Most Air Pollution in 2023
Top Countries By Forest Growth Since 2001
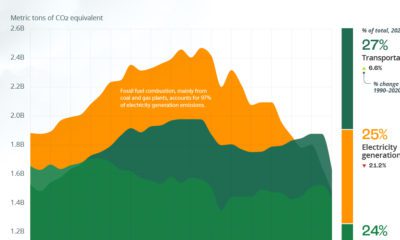
The U.S. emits about 6 billion metric tons of greenhouse gases a year. Here's how these emissions rank by sector.
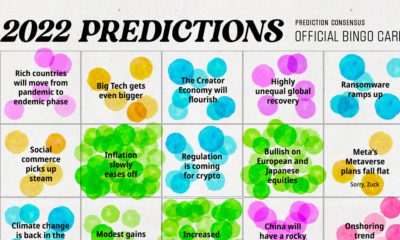
We analyzed 300+ articles, reports, and interviews to answer the question: is there any consensus on 2022 predictions? Here are the results.
2021 was a strong year for stocks, commodities, and cryptocurrencies, as most asset classes provided positive returns.
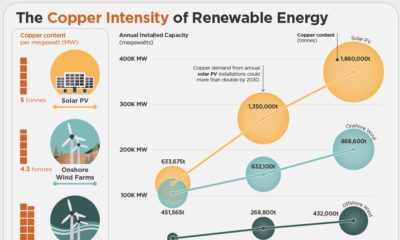
Copper is critical for the transition to clean energy. This infographic charts the copper usage of renewable energy technologies.
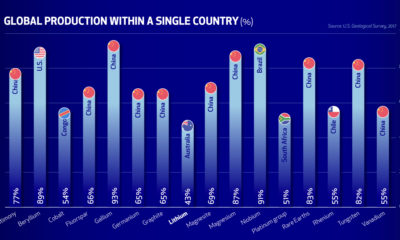
The U.S. finds itself in a precarious position, depending largely on China and other foreign nations for the critical minerals needed in the new energy era.
A clean energy transition is underway as wind, solar, and batteries take center stage. Here's how copper plays the critical role in these technologies.
Mineral exploration produces massive amounts of data. With AI, geologists can produce geological insights from this data to make the next discovery.
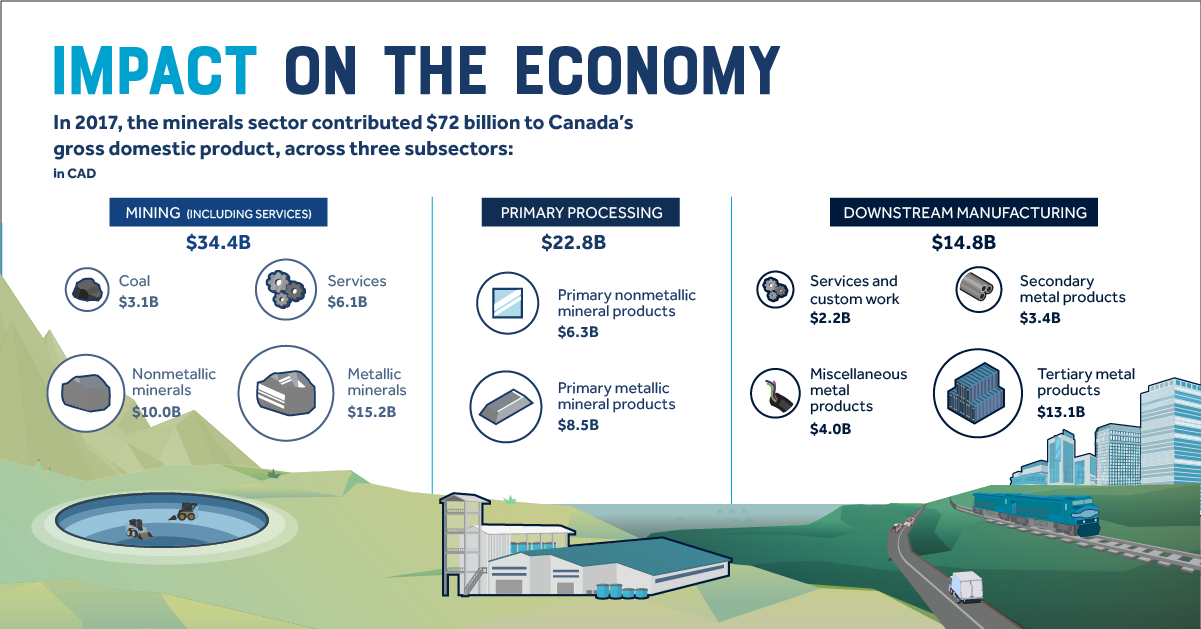
An intro to Canada's vast mining sector, including its impact on the economy and the innovations that will set the global standard for mining in the...
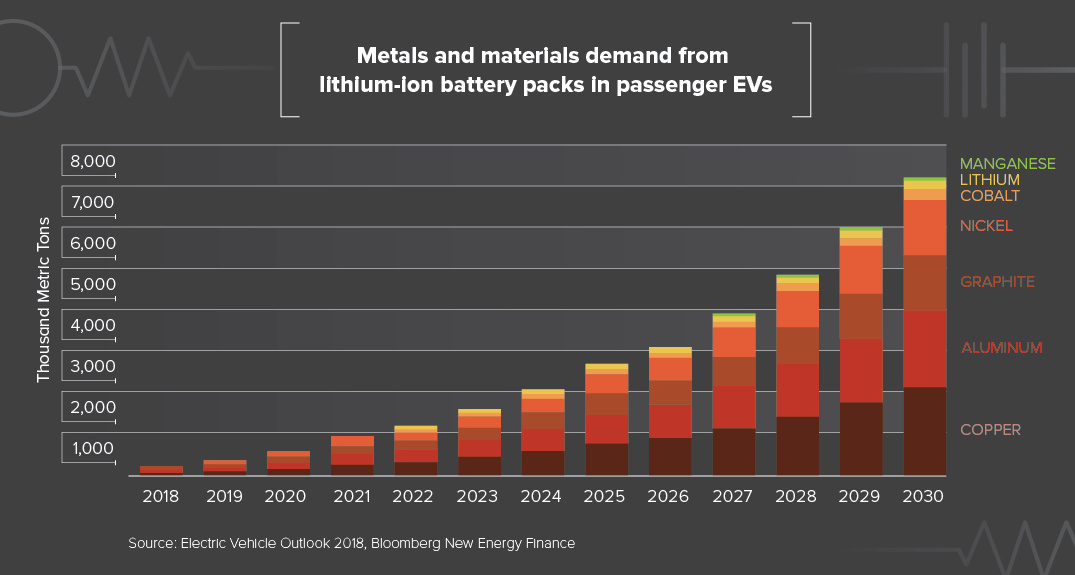
The fast-growing EV sector, along with rising demand for renewable energy sources, could be the spark that ignites an extended base metal boom.
The third infographic in our Rise of Tesla Series showcases Musk's ambitious vision for the future of Tesla, along with the products that will make it...