Mapped: The 10 U.S. States With the Lowest Real GDP Growth
Ranked: The World’s 50 Largest Private Equity Firms
Top 10 Countries Most in Debt to the IMF
Ranked: The Top 6 Economies by Share of Global GDP (1980-2024)
Mapped: Europe’s GDP Per Capita, by Country
Countries With the Highest Rates of Crypto Ownership
Mapped: The Number of AI Startups By Country
All of the Grants Given by the U.S. CHIPS Act
Visualizing AI Patents by Country
How Tech Logos Have Evolved Over Time
Visualizing America’s Average Retirement Savings, by Age
Visualizing the Tax Burden of Every U.S. State
Charted: What Frustrates Americans About the Tax System
Ranked: The Top 20 Countries in Debt to China
Mapped: Countries Where Recreational Cannabis is Legal
Which Countries Have the Highest Infant Mortality Rates?
Life Expectancy by Region (1950-2050F)
What Causes Preventable Child Deaths?
The Cost of an EpiPen in Major Markets
Who’s Building the Most Solar Energy?
Mapped: The Age of Energy Projects in Interconnection Queues, by State
Ranked: The Top 10 EV Battery Manufacturers in 2023
The World’s Biggest Nuclear Energy Producers
The World’s Biggest Oil Producers in 2023
Mapped: The Top Exports in Asian Countries
Mapped: U.S. States By Number of Cities Over 250,000 Residents
Mapped: U.S. Immigrants by Region
The Biggest Salt Producing Countries in 2023
Visualizing Copper Production by Country in 2023
Where the World’s Aluminum is Smelted, by Country
Visualizing Global Gold Production in 2023
How People Get Around in America, Europe, and Asia
The Carbon Footprint of Major Travel Methods
Ranking the Top 15 Countries by Carbon Tax Revenue
Ranked: The Countries With the Most Air Pollution in 2023
Top Countries By Forest Growth Since 2001
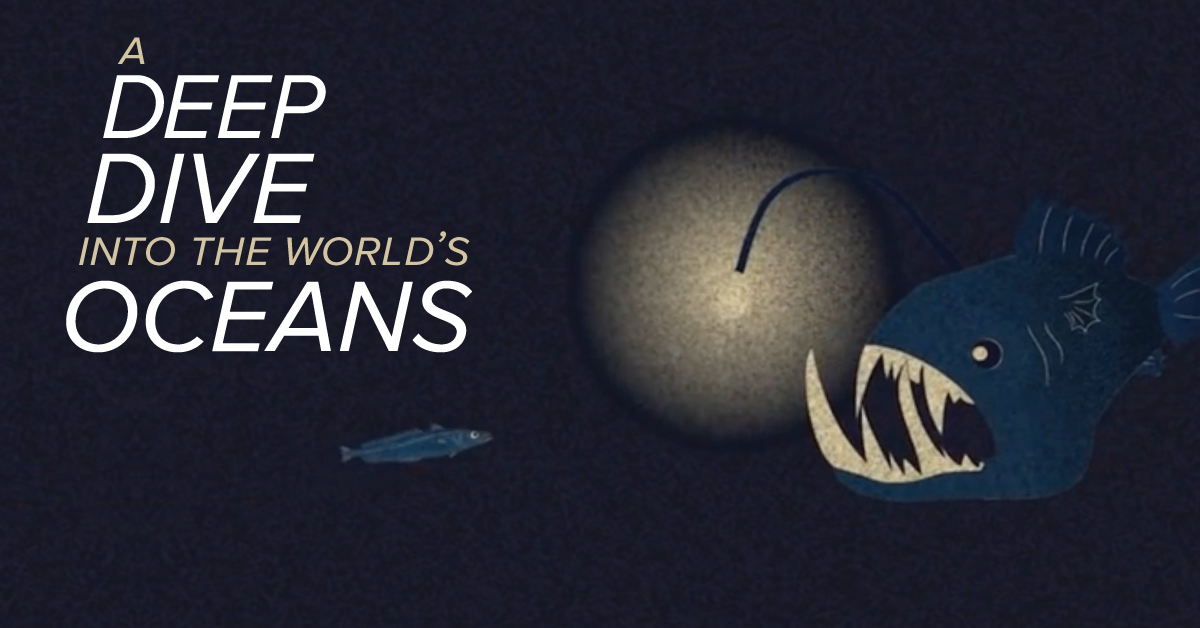
95% of the world’s oceans remain unexplored. Today's video helps shed some light on just how deep the ocean is and what little we do know...
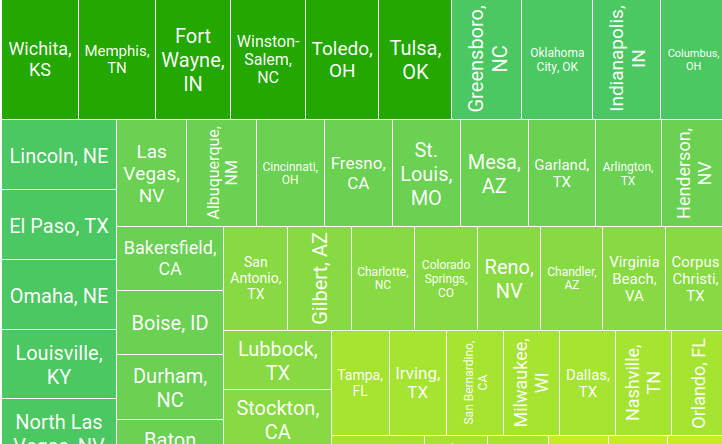
With rental prices rising sharply across the U.S., these interactive graphics show the trade-off between the cost and size in the 100 largest metro areas.
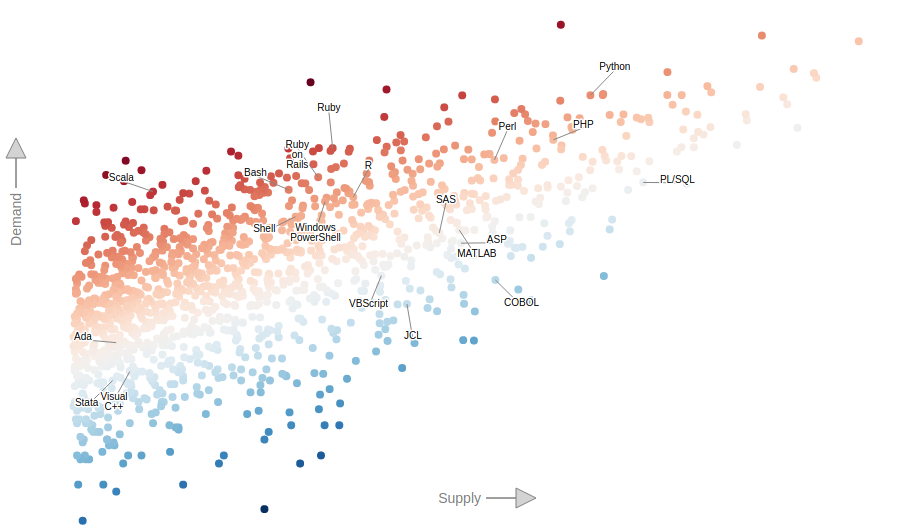
The interactive graphic helps us to visualize the relationship between the supply and demand for over 1,400 technology skills.
YouTube, Facebook, and email are ubiquitous now, but they all started out with a single post, profile, or message. Take a trip down the memory superhighway.
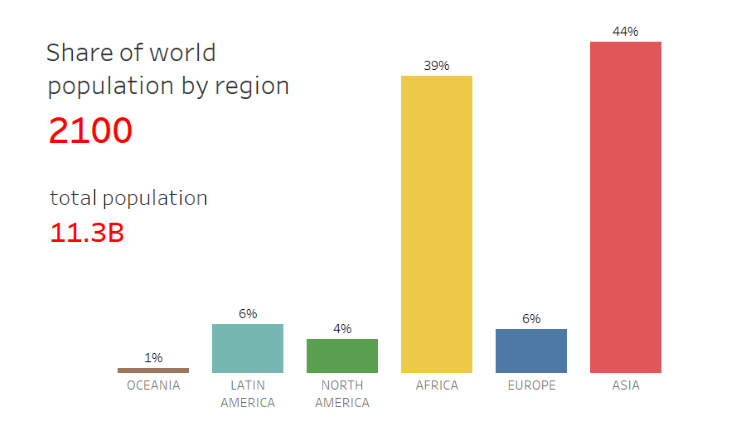
Based on data and projections from the U.N. Population Division, here is how the world's population will shift between 1950 and 2100, sorted by region.
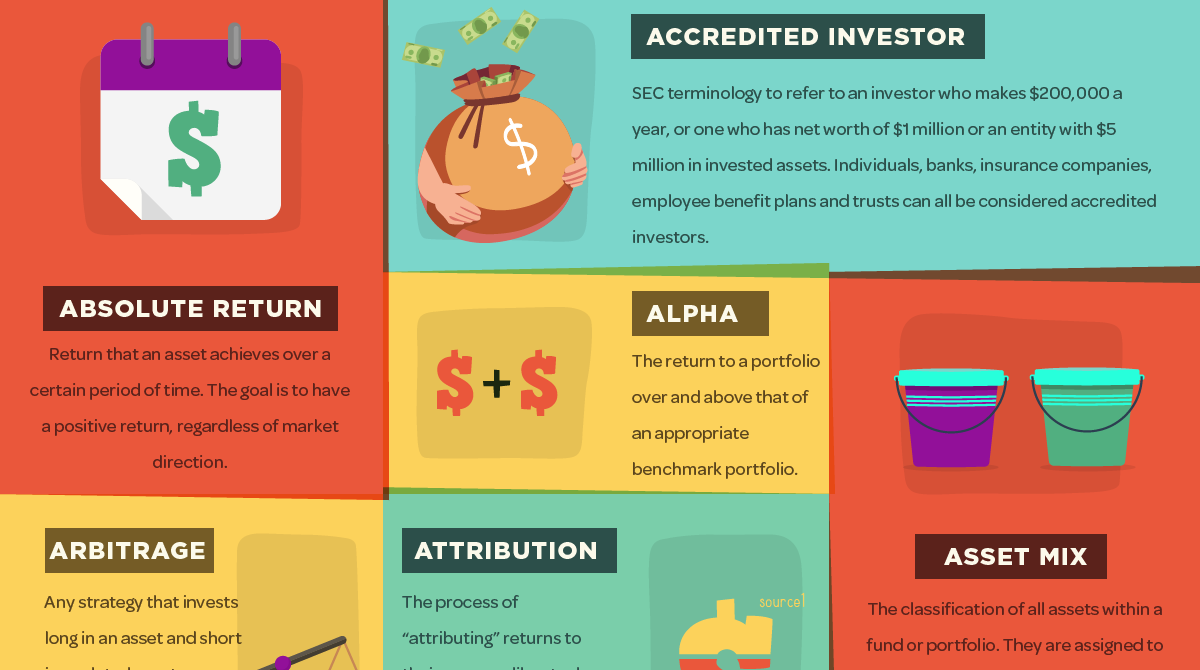
Hedge funds may seem secretive and mysterious at first, but this infographic helps to make them more understandable. Here's 48 hedge fund terms you should know.
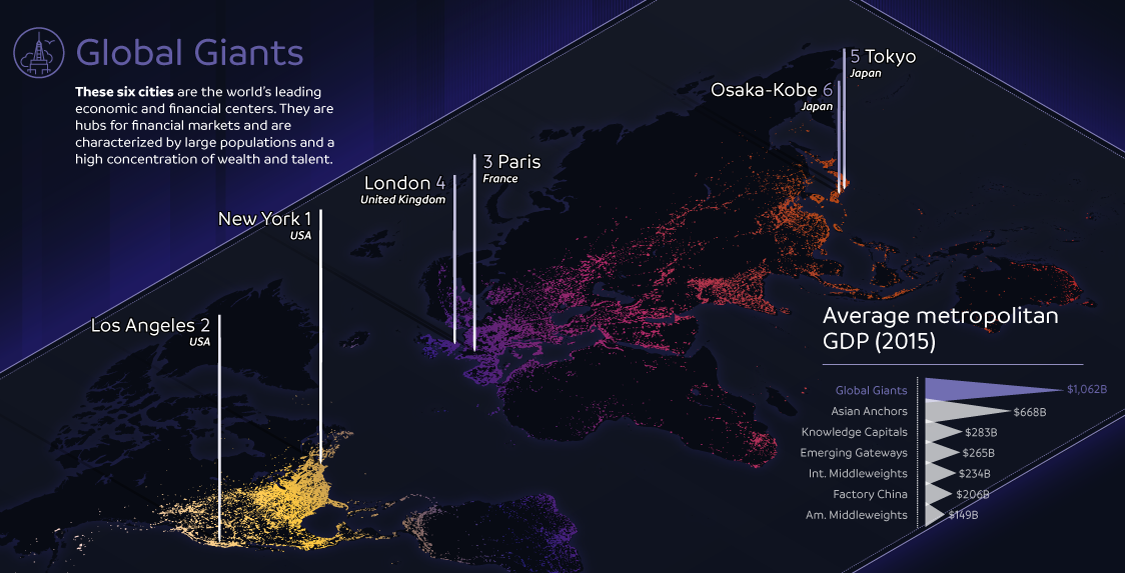
The world's largest 123 cities generate an astonishing $36 trillion in GDP per year. This infographic breaks these global cities down into seven typologies.
Timeless advice from highly successful entrepreneurs on how to build a business and personal habits that will lead to making a big impact.
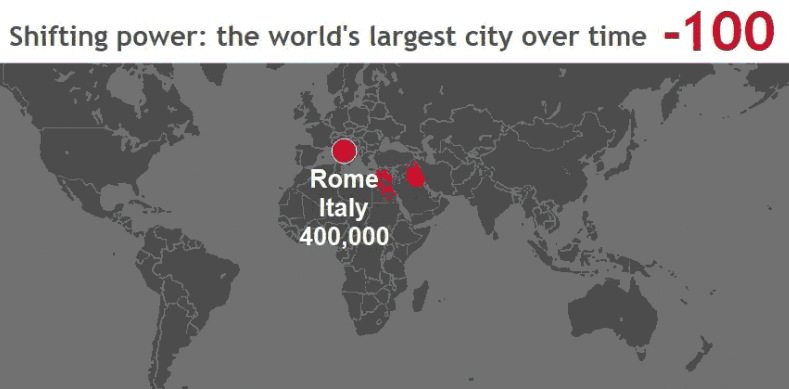
These stunning animations and interactive maps show the changing title for the world's largest city, as well as the rapid pace of urbanization in today's world.
Instant messaging crossed into the mainstream in the 1990s, allowing friends and like-minded thinkers from all over the world to connect in real-time.