Mapped: The 10 U.S. States With the Lowest Real GDP Growth
Ranked: The World’s 50 Largest Private Equity Firms
Top 10 Countries Most in Debt to the IMF
Ranked: The Top 6 Economies by Share of Global GDP (1980-2024)
Mapped: Europe’s GDP Per Capita, by Country
Countries With the Highest Rates of Crypto Ownership
Mapped: The Number of AI Startups By Country
All of the Grants Given by the U.S. CHIPS Act
Visualizing AI Patents by Country
How Tech Logos Have Evolved Over Time
Visualizing America’s Average Retirement Savings, by Age
Visualizing the Tax Burden of Every U.S. State
Charted: What Frustrates Americans About the Tax System
Ranked: The Top 20 Countries in Debt to China
Mapped: Countries Where Recreational Cannabis is Legal
Which Countries Have the Highest Infant Mortality Rates?
Life Expectancy by Region (1950-2050F)
What Causes Preventable Child Deaths?
The Cost of an EpiPen in Major Markets
Who’s Building the Most Solar Energy?
Mapped: The Age of Energy Projects in Interconnection Queues, by State
Ranked: The Top 10 EV Battery Manufacturers in 2023
The World’s Biggest Nuclear Energy Producers
The World’s Biggest Oil Producers in 2023
Mapped: The Top Exports in Asian Countries
Mapped: U.S. States By Number of Cities Over 250,000 Residents
Mapped: U.S. Immigrants by Region
The Biggest Salt Producing Countries in 2023
Visualizing Copper Production by Country in 2023
Where the World’s Aluminum is Smelted, by Country
Visualizing Global Gold Production in 2023
How People Get Around in America, Europe, and Asia
The Carbon Footprint of Major Travel Methods
Ranking the Top 15 Countries by Carbon Tax Revenue
Ranked: The Countries With the Most Air Pollution in 2023
Top Countries By Forest Growth Since 2001
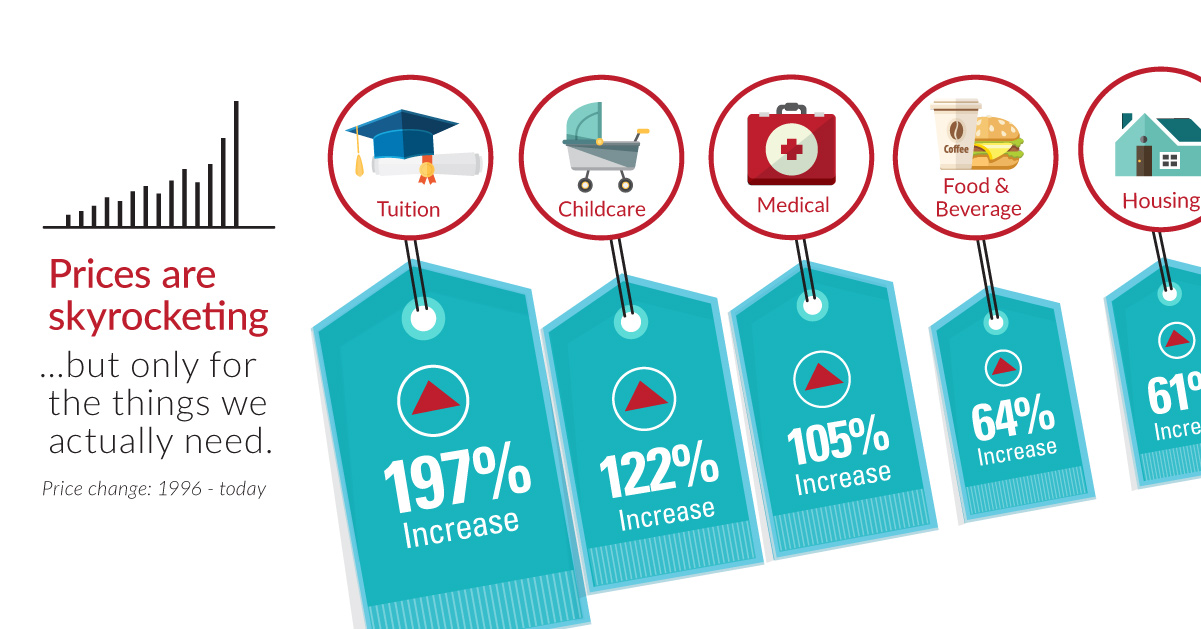
Over the last 20 years, the things that are the most important to us, such as healthcare, education, food, and shelter, have skyrocketing prices.
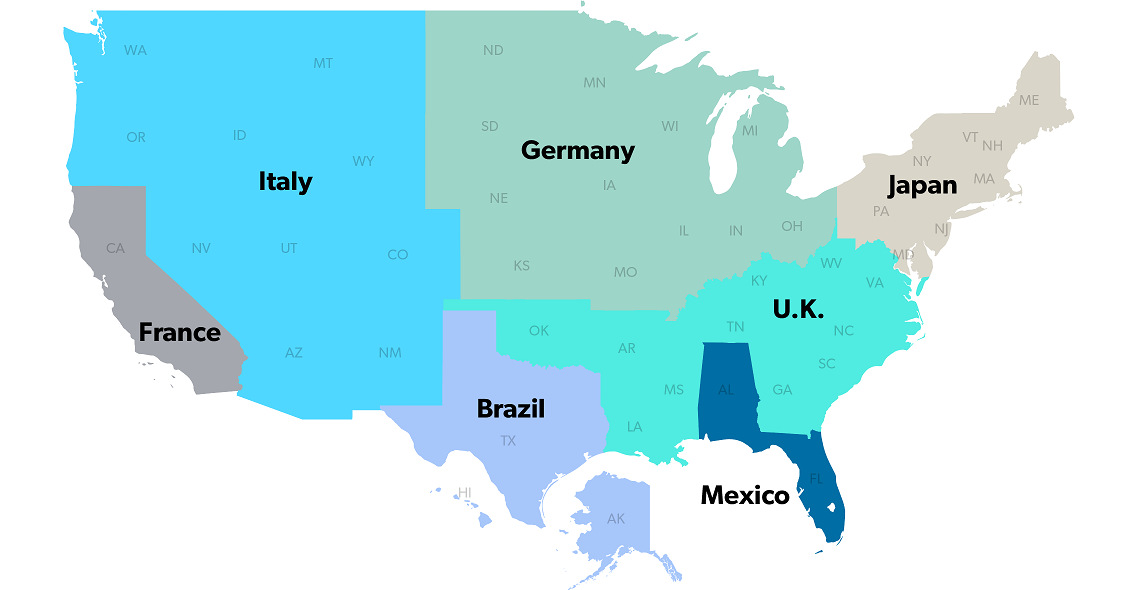
The United States has a $18 trillion economy - the biggest in the world. But here's another way of looking at it, using three interesting maps.
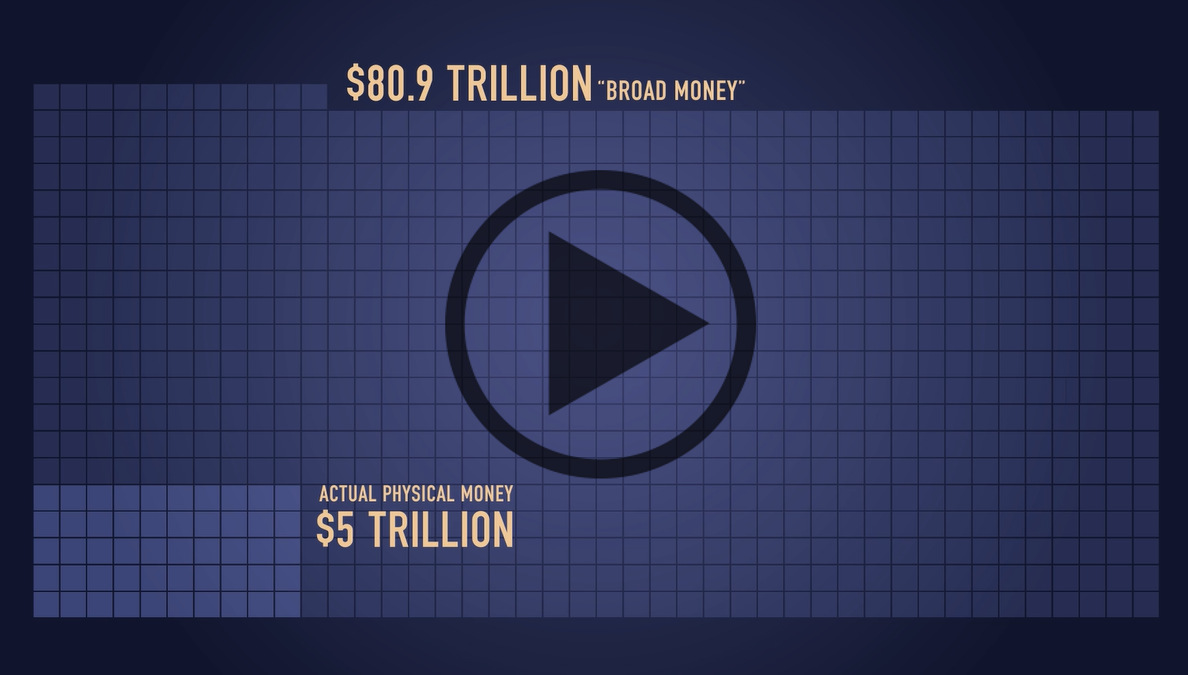
It's so much, that simply telling you wouldn't convey the magnitude. That's why we created this video, which visualizes how much money humans have created.
In 2015, Americans bet $149 billion illegally on sports. But what is legal, what is not? Learn about the sports betting industry in this infographic.
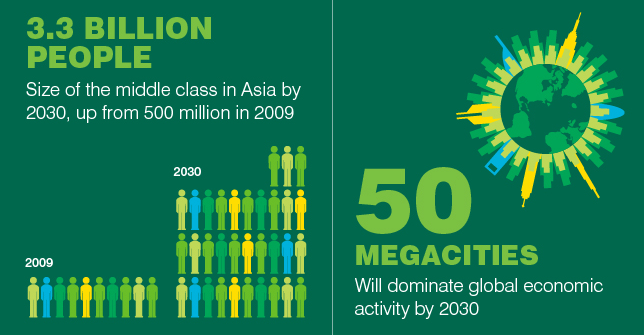
What will be the driving factors behind global real estate investing over the coming years? This infographic covers three that are worth keeping an eye on.
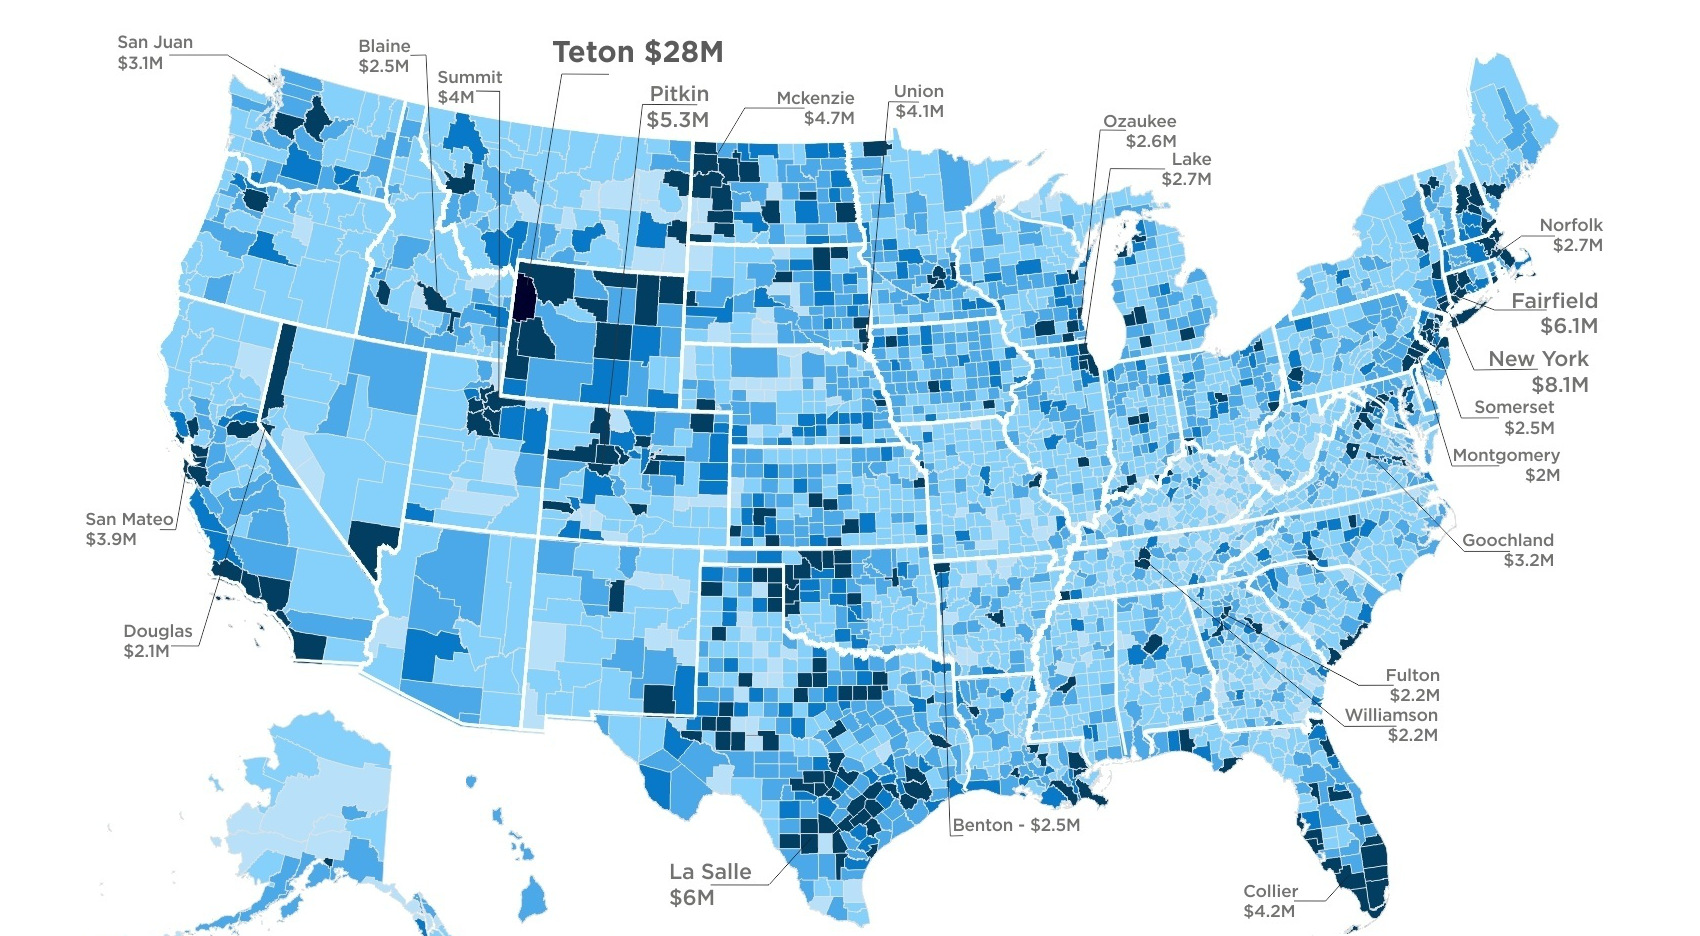
To make it into the Top 1% of US earners, you must make $521k. However, avg income of the 1% varies wildly at a county level,...
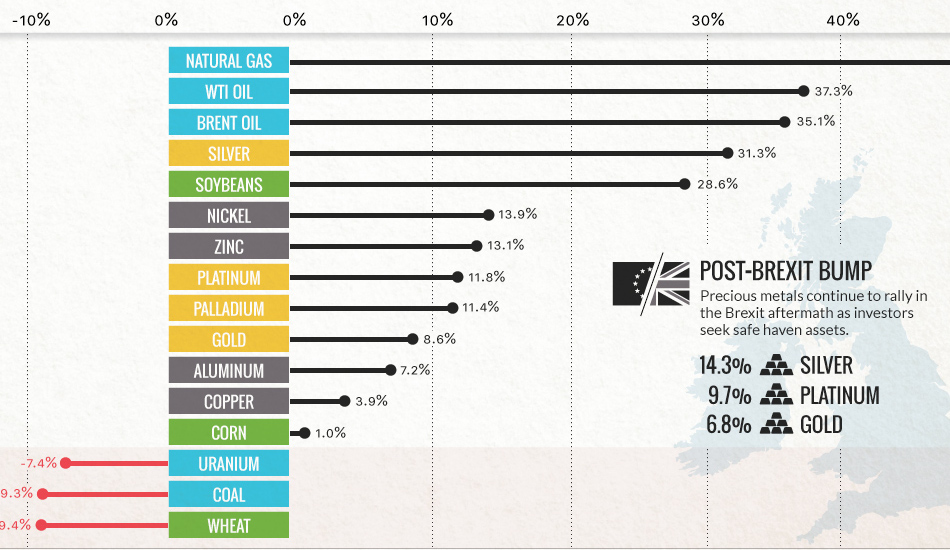
Commodities are back! Precious metals hit two-year highs post-Brexit, while oil and natural gas had their best quarter in years.
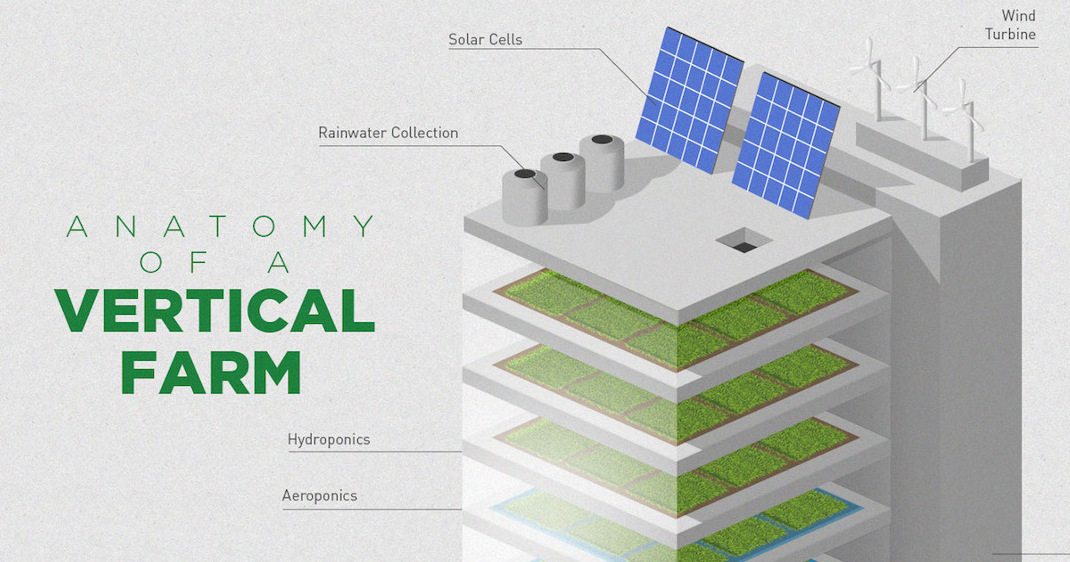
What if a skyscraper could supply sustainable farm food to the city more efficiently and profitably? This infographic explains how vertical farming works.
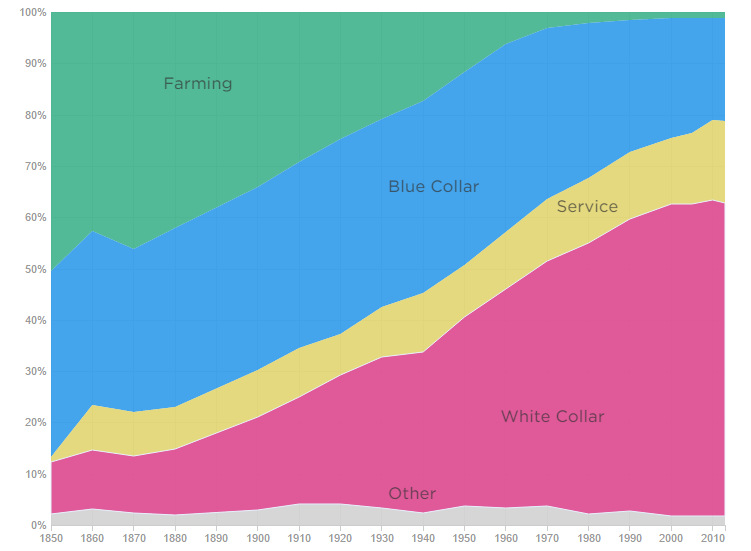
These graphics show how machines have destroyed jobs over time - but also how they create new ones in the process.
How do the emissions of electric and gas vehicles compare in your state? See if driving a Tesla is better for the environment in this in-depth...