Markets
Video: How Much Money Have Humans Created?
The Money Project is an ongoing collaboration between Visual Capitalist and Texas Precious Metals that seeks to use intuitive visualizations to explore the origins, nature, and use of money.
How Much Money Have Humans Created?
The dollar amounts are so staggering, that simply telling you how much money humans have created probably wouldn’t convey the magnitude.
However, by using data visualization in this video, we can relate numbers in the millions, billions, and trillions to create the context to make it more understandable.
Starting With Context
The median U.S. household income of $54,000 is a number that most people can relate to. It’s enough money to save up to buy a car, or maybe even a house depending on where you live.
Multiply that income by eight, and that number is now big enough to count as being in the top 1% of earners. People in the “one percent” make at least $430,000 per year.
Famous celebrities and businesspeople have fortunes that dwarf those of many “one percenters”. Actor George Clooney, for example, has a net worth of $180 million. Meanwhile, author J.K. Rowling is estimated to have a net worth of roughly $1 billion according to Forbes.
Zuckerberg takes things to a whole new level. His net worth worth is $53 billion, thanks to the value of Facebook stock. Lastly, Bill Gates regularly tops the “richest people” lists with a wealth of $75 billion – though lately that number has been a little higher based on stock fluctuations.
However, even the wealth of the richest human on Earth is not enough to get up to our unit of measurement that we use in the video: each square is equal to $100 billion.
The World’s Money
Some of the world’s biggest companies take up just a few squares with our unit of measurement. ExxonMobil for example has a market capitalization of about $350 billion, and the world’s largest public company by market capitalization, Apple, is at about $600 billion.
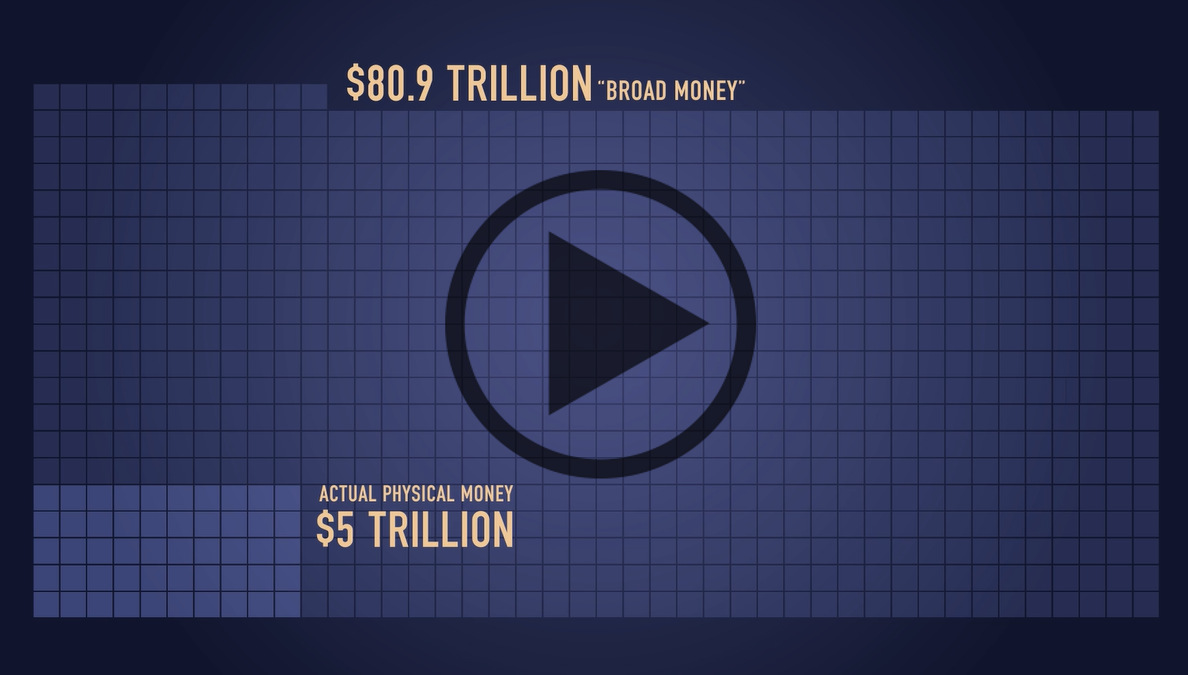
The total of the world’s physical currency – all coins and bills denominated in dollars, euros, yen, and other currencies – is about $5 trillion.
Meanwhile, if we add checking accounts to the equation, the number for the amount of money in the world goes up to $28.6 trillion according to the CIA World Factbook. This is called “narrow money”.
Add all money market, savings, and time deposits, and the number jumps up to $80.9 trillion – or “broad money”.
But that’s nothing compared to the world of Wall Street.
Wall Street
All stock markets added together are worth $70 trillion, and global debt is $199 trillion.
That’s all impressive, but the derivatives market takes the cake. Derivatives are contracts between parties that derive value from the performance of underlying assets, indices, or entities. On the low end, the notional value of the derivatives market is estimated to be a whopping $630 trillion according to the Bank of International Settlements.
However, that only accounts for OTC (over-the-counter) derivatives, and the truth is that no one actually knows the size of the derivatives market. It’s been estimated by some that it could be as high as $1.2 quadrillion, and others estimate it could be even higher.
There are many financial critics who worry about the risk that these contracts pile onto the global financial system. With the sheer size of the derivative market dwarfing all others, it’s understandable why business mogul Warren Buffett has called derivatives “financial weapons of mass destruction”.
About the Money Project
The Money Project aims to use intuitive visualizations to explore ideas around the very concept of money itself. Founded in 2015 by Visual Capitalist and Texas Precious Metals, the Money Project will look at the evolving nature of money, and will try to answer the difficult questions that prevent us from truly understanding the role that money plays in finance, investments, and accumulating wealth.


Markets
U.S. Debt Interest Payments Reach $1 Trillion
U.S. debt interest payments have surged past the $1 trillion dollar mark, amid high interest rates and an ever-expanding debt burden.


U.S. Debt Interest Payments Reach $1 Trillion
This was originally posted on our Voronoi app. Download the app for free on iOS or Android and discover incredible data-driven charts from a variety of trusted sources.
The cost of paying for America’s national debt crossed the $1 trillion dollar mark in 2023, driven by high interest rates and a record $34 trillion mountain of debt.
Over the last decade, U.S. debt interest payments have more than doubled amid vast government spending during the pandemic crisis. As debt payments continue to soar, the Congressional Budget Office (CBO) reported that debt servicing costs surpassed defense spending for the first time ever this year.
This graphic shows the sharp rise in U.S. debt payments, based on data from the Federal Reserve.
A $1 Trillion Interest Bill, and Growing
Below, we show how U.S. debt interest payments have risen at a faster pace than at another time in modern history:
| Date | Interest Payments | U.S. National Debt |
|---|---|---|
| 2023 | $1.0T | $34.0T |
| 2022 | $830B | $31.4T |
| 2021 | $612B | $29.6T |
| 2020 | $518B | $27.7T |
| 2019 | $564B | $23.2T |
| 2018 | $571B | $22.0T |
| 2017 | $493B | $20.5T |
| 2016 | $460B | $20.0T |
| 2015 | $435B | $18.9T |
| 2014 | $442B | $18.1T |
| 2013 | $425B | $17.2T |
| 2012 | $417B | $16.4T |
| 2011 | $433B | $15.2T |
| 2010 | $400B | $14.0T |
| 2009 | $354B | $12.3T |
| 2008 | $380B | $10.7T |
| 2007 | $414B | $9.2T |
| 2006 | $387B | $8.7T |
| 2005 | $355B | $8.2T |
| 2004 | $318B | $7.6T |
| 2003 | $294B | $7.0T |
| 2002 | $298B | $6.4T |
| 2001 | $318B | $5.9T |
| 2000 | $353B | $5.7T |
| 1999 | $353B | $5.8T |
| 1998 | $360B | $5.6T |
| 1997 | $368B | $5.5T |
| 1996 | $362B | $5.3T |
| 1995 | $357B | $5.0T |
| 1994 | $334B | $4.8T |
| 1993 | $311B | $4.5T |
| 1992 | $306B | $4.2T |
| 1991 | $308B | $3.8T |
| 1990 | $298B | $3.4T |
| 1989 | $275B | $3.0T |
| 1988 | $254B | $2.7T |
| 1987 | $240B | $2.4T |
| 1986 | $225B | $2.2T |
| 1985 | $219B | $1.9T |
| 1984 | $205B | $1.7T |
| 1983 | $176B | $1.4T |
| 1982 | $157B | $1.2T |
| 1981 | $142B | $1.0T |
| 1980 | $113B | $930.2B |
| 1979 | $96B | $845.1B |
| 1978 | $84B | $789.2B |
| 1977 | $69B | $718.9B |
| 1976 | $61B | $653.5B |
| 1975 | $55B | $576.6B |
| 1974 | $50B | $492.7B |
| 1973 | $45B | $469.1B |
| 1972 | $39B | $448.5B |
| 1971 | $36B | $424.1B |
| 1970 | $35B | $389.2B |
| 1969 | $30B | $368.2B |
| 1968 | $25B | $358.0B |
| 1967 | $23B | $344.7B |
| 1966 | $21B | $329.3B |
Interest payments represent seasonally adjusted annual rate at the end of Q4.
At current rates, the U.S. national debt is growing by a remarkable $1 trillion about every 100 days, equal to roughly $3.6 trillion per year.
As the national debt has ballooned, debt payments even exceeded Medicaid outlays in 2023—one of the government’s largest expenditures. On average, the U.S. spent more than $2 billion per day on interest costs last year. Going further, the U.S. government is projected to spend a historic $12.4 trillion on interest payments over the next decade, averaging about $37,100 per American.
Exacerbating matters is that the U.S. is running a steep deficit, which stood at $1.1 trillion for the first six months of fiscal 2024. This has accelerated due to the 43% increase in debt servicing costs along with a $31 billion dollar increase in defense spending from a year earlier. Additionally, a $30 billion increase in funding for the Federal Deposit Insurance Corporation in light of the regional banking crisis last year was a major contributor to the deficit increase.
Overall, the CBO forecasts that roughly 75% of the federal deficit’s increase will be due to interest costs by 2034.

-

 Green1 week ago
Ranked: The Countries With the Most Air Pollution in 2023
-

 Automotive2 weeks ago
Almost Every EV Stock is Down After Q1 2024
-

 AI2 weeks ago
The Stock Performance of U.S. Chipmakers So Far in 2024
-

 Markets2 weeks ago
Charted: Big Four Market Share by S&P 500 Audits
-

 Real Estate2 weeks ago
Ranked: The Most Valuable Housing Markets in America
-

 Money2 weeks ago
Which States Have the Highest Minimum Wage in America?
-

 AI2 weeks ago
Ranked: Semiconductor Companies by Industry Revenue Share
-

 Travel2 weeks ago
Ranked: The World’s Top Flight Routes, by Revenue