Which Retailers Operate in the Most Countries?
Mapped: The 10 U.S. States With the Lowest Real GDP Growth
Ranked: The World’s 50 Largest Private Equity Firms
Top 10 Countries Most in Debt to the IMF
Ranked: The Top 6 Economies by Share of Global GDP (1980-2024)
Ranked: The Top Startup Cities Around the World
Visualizing the 5 Most Common Cybersecurity Mistakes
Countries With the Highest Rates of Crypto Ownership
Mapped: The Number of AI Startups By Country
All of the Grants Given by the U.S. CHIPS Act
Mapped: The Income a Family Needs to Live Comfortably in Every U.S. State
Visualizing America’s Average Retirement Savings, by Age
Visualizing the Tax Burden of Every U.S. State
Charted: What Frustrates Americans About the Tax System
Mapped: Countries Where Recreational Cannabis is Legal
Which Countries Have the Highest Infant Mortality Rates?
Life Expectancy by Region (1950-2050F)
What Causes Preventable Child Deaths?
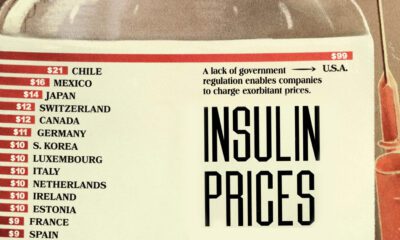
The Cost of an EpiPen in Major Markets
Ranked: The World’s Largest Lithium Producers in 2023
Who’s Building the Most Solar Energy?
Mapped: The Age of Energy Projects in Interconnection Queues, by State
Ranked: The Top 10 EV Battery Manufacturers in 2023
The World’s Biggest Nuclear Energy Producers
Mapped: The World’s Wettest and Driest Countries
Mapped: Indian States with Cities Over 1 Million People
Mapped: The Top Export in Each EU Country
The Biggest Salt Producing Countries in 2023
Visualizing Copper Production by Country in 2023
Where the World’s Aluminum is Smelted, by Country
Visualizing Global Gold Production in 2023
How People Get Around in America, Europe, and Asia
The Carbon Footprint of Major Travel Methods
Ranking the Top 15 Countries by Carbon Tax Revenue
Ranked: The Countries With the Most Air Pollution in 2023
Top Countries By Forest Growth Since 2001
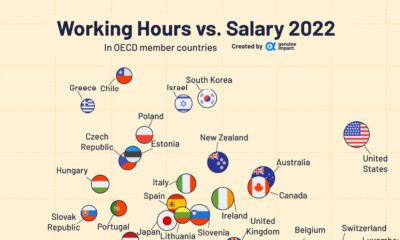
What are the average work hours and salaries in OECD countries? We look at the data for trends across regions.
This visual highlights the cost of insulin by country, showing how much more expensive diabetes medicine is in the U.S.
Here are the most common investing mistakes to avoid, from emotionally-driven investing to paying too much in fees.
Considering factors like the cost of investment and number of locations, this graphic breaks down the best franchises in the U.S.
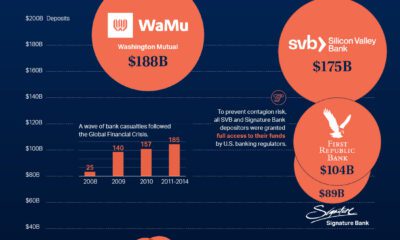
This graphic charts over 560 U.S. bank failures since 2001, including the most recent addition: First Republic Bank.
This pie chart, circa 1914, is a fascinating breakdown of China's export economy just prior to World War I.
The U.S. labor market is remarkably strong, with a 3.4% unemployment rate. Which sectors are seeing the highest job gains in 2023?
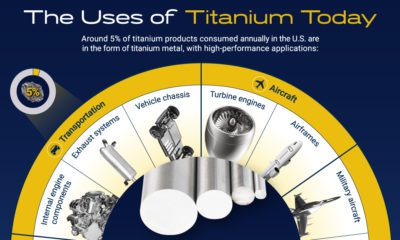
This infographic explores titanium's growth markets and potential for mainstream application.
Japanese automakers like Toyota are known to produce some of the longest lasting cars in the world, but does the data support this claim?
In this ninth edition of our yearly round-up, we highlight visualizations that broke new ground in design and data-driven reporting.


 Creator Program