Comparing Saudi Aramco’s $1.9T Valuation to Its Rivals
The Top Retailers in the World, by Store Count
Visualizing Berkshire Hathaway’s Stock Portfolio (Q1 2024)
Nvidia is Worth More Than All of These Companies Combined
Which Retailers Operate in the Most Countries?
What Laptop Brands do Americans Use in 2024?
Ranked: The Top Startup Cities Around the World
Visualizing the 5 Most Common Cybersecurity Mistakes
Countries With the Highest Rates of Crypto Ownership
Mapped: The Income a Family Needs to Live Comfortably in Every U.S. State
Top 10 Countries Most in Debt to the IMF
Visualizing America’s Average Retirement Savings, by Age
Visualizing the Tax Burden of Every U.S. State
Charted: What Frustrates Americans About the Tax System
Visualizing Daily Protein Sources by Region
Mapped: Countries Where Recreational Cannabis is Legal
Which Countries Have the Highest Infant Mortality Rates?
Life Expectancy by Region (1950-2050F)
What Causes Preventable Child Deaths?
Ranked: The World’s Largest Lithium Producers in 2023
Who’s Building the Most Solar Energy?
Mapped: The Age of Energy Projects in Interconnection Queues, by State
Ranked: The Top 10 EV Battery Manufacturers in 2023
Mapped: The World’s Largest Armies in 2024
Mapped: Chinese Provinces With Cities Over 1 Million People
Map: Where Are America’s Largest Landfills?
Mapped: The World’s Wettest and Driest Countries
Visualizing Cobalt Production by Country in 2023
The Biggest Salt Producing Countries in 2023
Visualizing Copper Production by Country in 2023
Where the World’s Aluminum is Smelted, by Country
How People Get Around in America, Europe, and Asia
The Carbon Footprint of Major Travel Methods
Ranking the Top 15 Countries by Carbon Tax Revenue
Ranked: The Countries With the Most Air Pollution in 2023
Top Countries By Forest Growth Since 2001
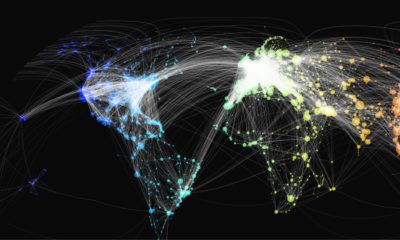
This map shows over 65,000 of the world’s flight paths and the various airports that each route connects, using data from Open Flights.
This graphic uses data taken from latest official censuses and projections to rank the largest cities by population.
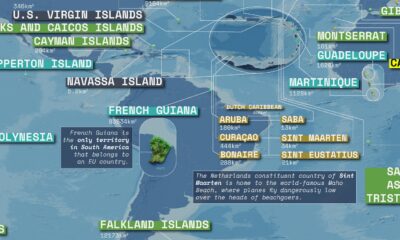
This massive map highlights overseas territories and dependencies around the world and their sovereign states.
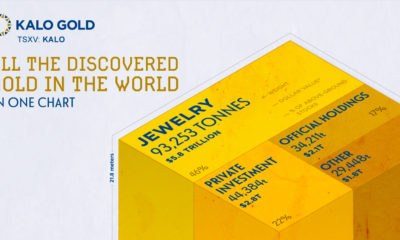
How much gold is in the world? This infographic visualizes all the gold ever mined and the reserves that remain underground.
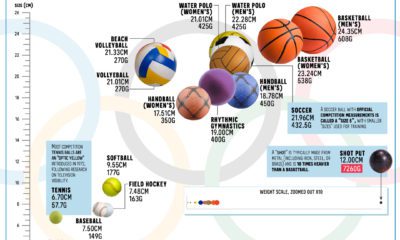
Here are the different sizes and weights of each Olympic sports ball used in the Tokyo Olympics.
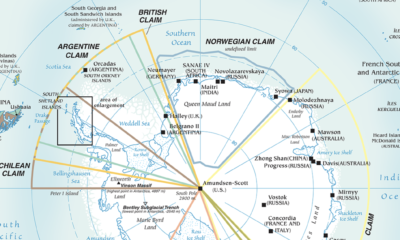
Antarctica is the most inhospitable region on Earth, but that hasn't stopped countries from making territorial claims. This maps shows them all.
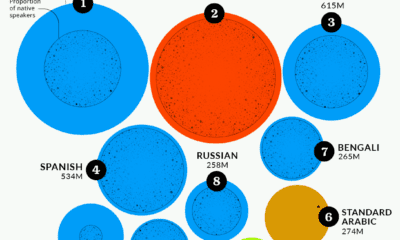
While English is the world's most spoken language, it has fewer native speakers than either Mandarin Chinese or Spanish.
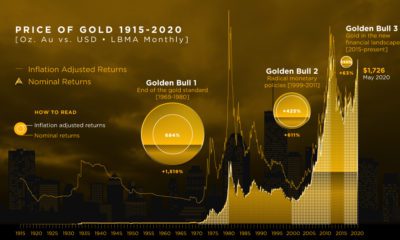
We break down gold's three major bull markets over the last century. This includes the current one, in which gold has hit 8-year highs.
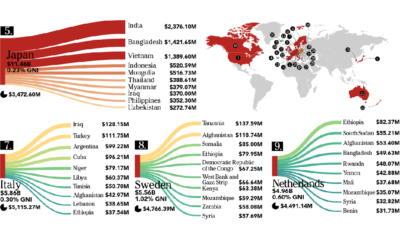
This infographic looks at who is giving – and who is receiving – the billions of dollars in foreign aid that flows between countries each year.
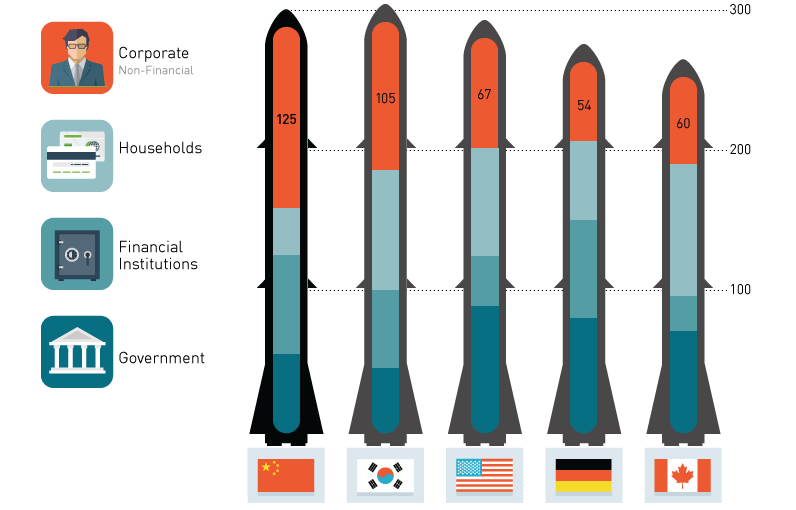
No one knows the size of China's debt bomb. Here we look at estimates of the payload as well as what could potentially ignite the fuse.


 Creator Program