Comparing Saudi Aramco’s $1.9T Valuation to Its Rivals
The Top Retailers in the World, by Store Count
Visualizing Berkshire Hathaway’s Stock Portfolio (Q1 2024)
Nvidia is Worth More Than All of These Companies Combined
Which Retailers Operate in the Most Countries?
Visualizing the Top Countries, by Mobile Data Usage
What Laptop Brands do Americans Use in 2024?
Ranked: The Top Startup Cities Around the World
Visualizing the 5 Most Common Cybersecurity Mistakes
Mapped: The Income a Family Needs to Live Comfortably in Every U.S. State
Top 10 Countries Most in Debt to the IMF
Visualizing America’s Average Retirement Savings, by Age
Visualizing the Tax Burden of Every U.S. State
Charted: What Frustrates Americans About the Tax System
Visualizing Daily Protein Sources by Region
Mapped: Countries Where Recreational Cannabis is Legal
Which Countries Have the Highest Infant Mortality Rates?
Life Expectancy by Region (1950-2050F)
What Causes Preventable Child Deaths?
Ranked: The World’s Largest Lithium Producers in 2023
Who’s Building the Most Solar Energy?
Mapped: The Age of Energy Projects in Interconnection Queues, by State
Ranked: The Top 10 EV Battery Manufacturers in 2023
Mapped: The World’s Largest Armies in 2024
Mapped: Chinese Provinces With Cities Over 1 Million People
Map: Where Are America’s Largest Landfills?
Mapped: The World’s Wettest and Driest Countries
Visualizing Cobalt Production by Country in 2023
The Biggest Salt Producing Countries in 2023
Visualizing Copper Production by Country in 2023
Where the World’s Aluminum is Smelted, by Country
How People Get Around in America, Europe, and Asia
The Carbon Footprint of Major Travel Methods
Ranking the Top 15 Countries by Carbon Tax Revenue
Ranked: The Countries With the Most Air Pollution in 2023
Top Countries By Forest Growth Since 2001
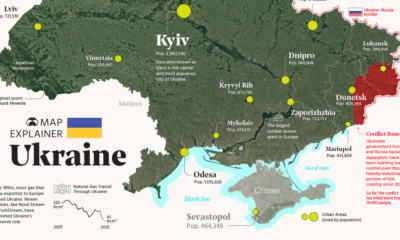
Ukraine has made the headlines due to the ongoing tensions with Russia. In this map infographic, we examine Ukraine from a structural point of view.
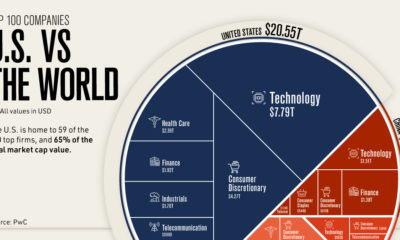
Where are the top 100 companies of the world located? We highlight the U.S. share of the top companies by market capitalization .
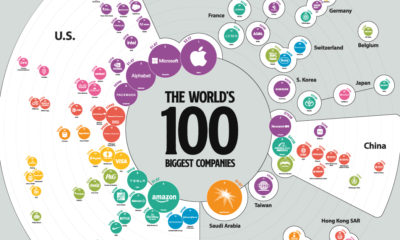
The 100 biggest companies in the world were worth a record-breaking $31.7 trillion as of the end of Q1, up 48% year-over-year.
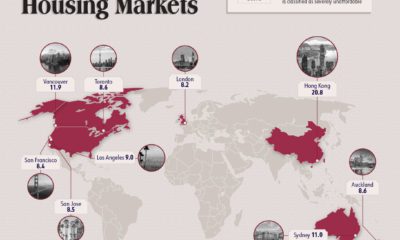
For the 10th consecutive year, Hong Kong ranks as the least affordable city. Vancouver Canada is the second, followed by Sydney, Australia.
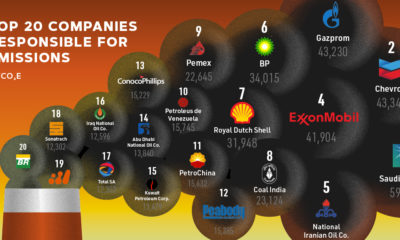
Since 1965, over ⅓ of the world’s cumulative carbon emissions can be traced back to just 20 fossil fuel companies. Who are the biggest contributors?
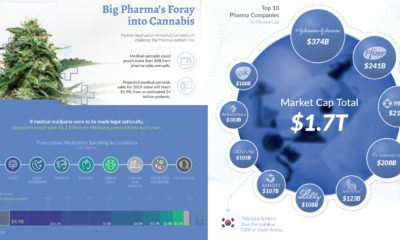
The Big Pharma industry is entering the cannabis space, by swapping patients for patents. But what are the impacts of such a takeover?
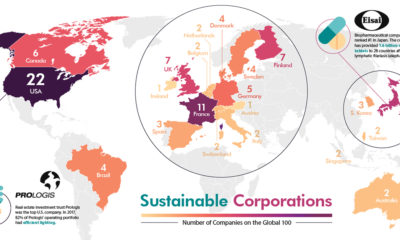
The world's most sustainable corporations have a monumental impact on social and environmental issues. See where they are located in this visualization.
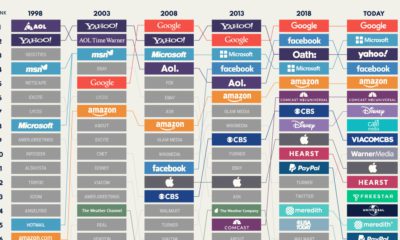
A lot has changed since Yahoo and AOL were the homepages of choice. This visualization looks at the largest internet giants in the U.S. since 1998.
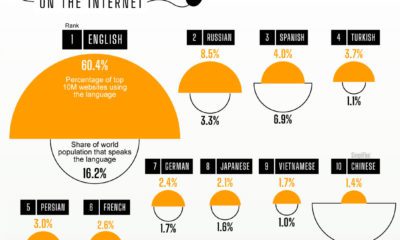
The internet is a truly global phenomenon, but a handful of languages dominate the digital world. Over 60% of the top 10 million webpages feature content...
Here’s a look at the different parts of Amazon’s revenue model, and how much money each business segment makes.