Misc
Mapped: Second Primary Languages Around the World

Mapped: Second Primary Languages Around the World
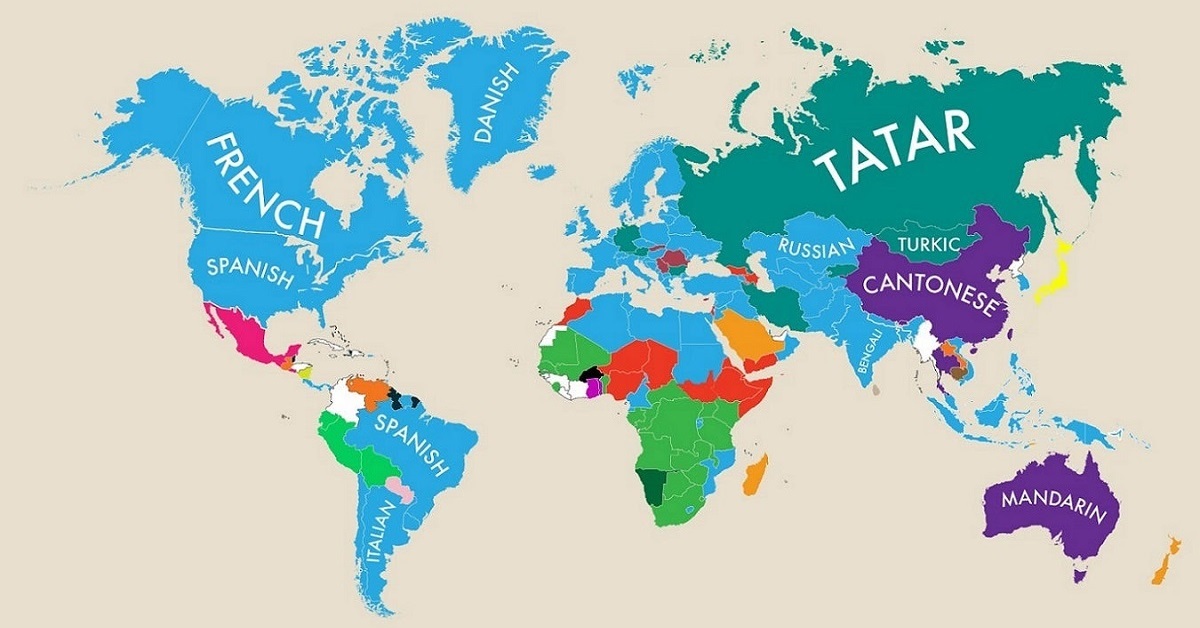
After the primary language, what second languages are used as native tongues in your country?
The answer reveals a lot about history and location. Whether through immigration, colonization, or local culture, a primary language can either spread around the world or remain rooted in place.
This map from MoveHub shows the second most commonly spoken primary language in most countries, using data from the CIA World Factbook and Wikipedia as of February 2021.
The Difference Between Primary and Secondary Languages
First, it’s important to differentiate between primary languages and secondary languages.
A primary language—also known as a first or native language—is the language we use most frequently to communicate. These are languages we are usually born with, have a lot of exposure to, and use at home.
On the other hand, a secondary language is one we learn or pick up after our primary language. In many countries, English is the most commonly learned, with close to 1 billion speakers.
But a map of common second languages can simply show just how many countries prioritize learning English, the de-facto international language in many organizations. Instead, this map highlights the movement of people by showing the second-most common primary language.
The Second Most Common Primary Languages by Country
Even when filtering by primary language use, however, English and other Indo-European languages dominate the world.
With 55 countries speaking it as the second-most common primary language, English came out on top.
| Top 10 Most Popular Second Primary Languages | Number of Countries |
|---|---|
| English | 55 |
| French | 14 |
| Russian | 13 |
| Spanish | 8 |
| Creole | 8 |
| Arabic | 6 |
| Kurdish | 4 |
| Portugese | 4 |
| Italian | 3 |
| Quechua | 3 |
The use of English as a second primary language was primarily concentrated in Western Europe, Northern Africa, and Southeast Asia and Oceania.
Similarly to second-place French with 14 countries and third-place Russian with 13 countries, English was most common in proximity to English-speaking countries or where there was a history of immigration.
Other second-most common primary languages highlighted different cultures within countries, such as China’s second-most common language Cantonese. Alternatively, they showed the primary indigenous language before colonization, such as the Quechua languages in South America.
What other interesting or surprising language patterns can you spot in the map above?
Misc
The Top 25 Nationalities of U.S. Immigrants
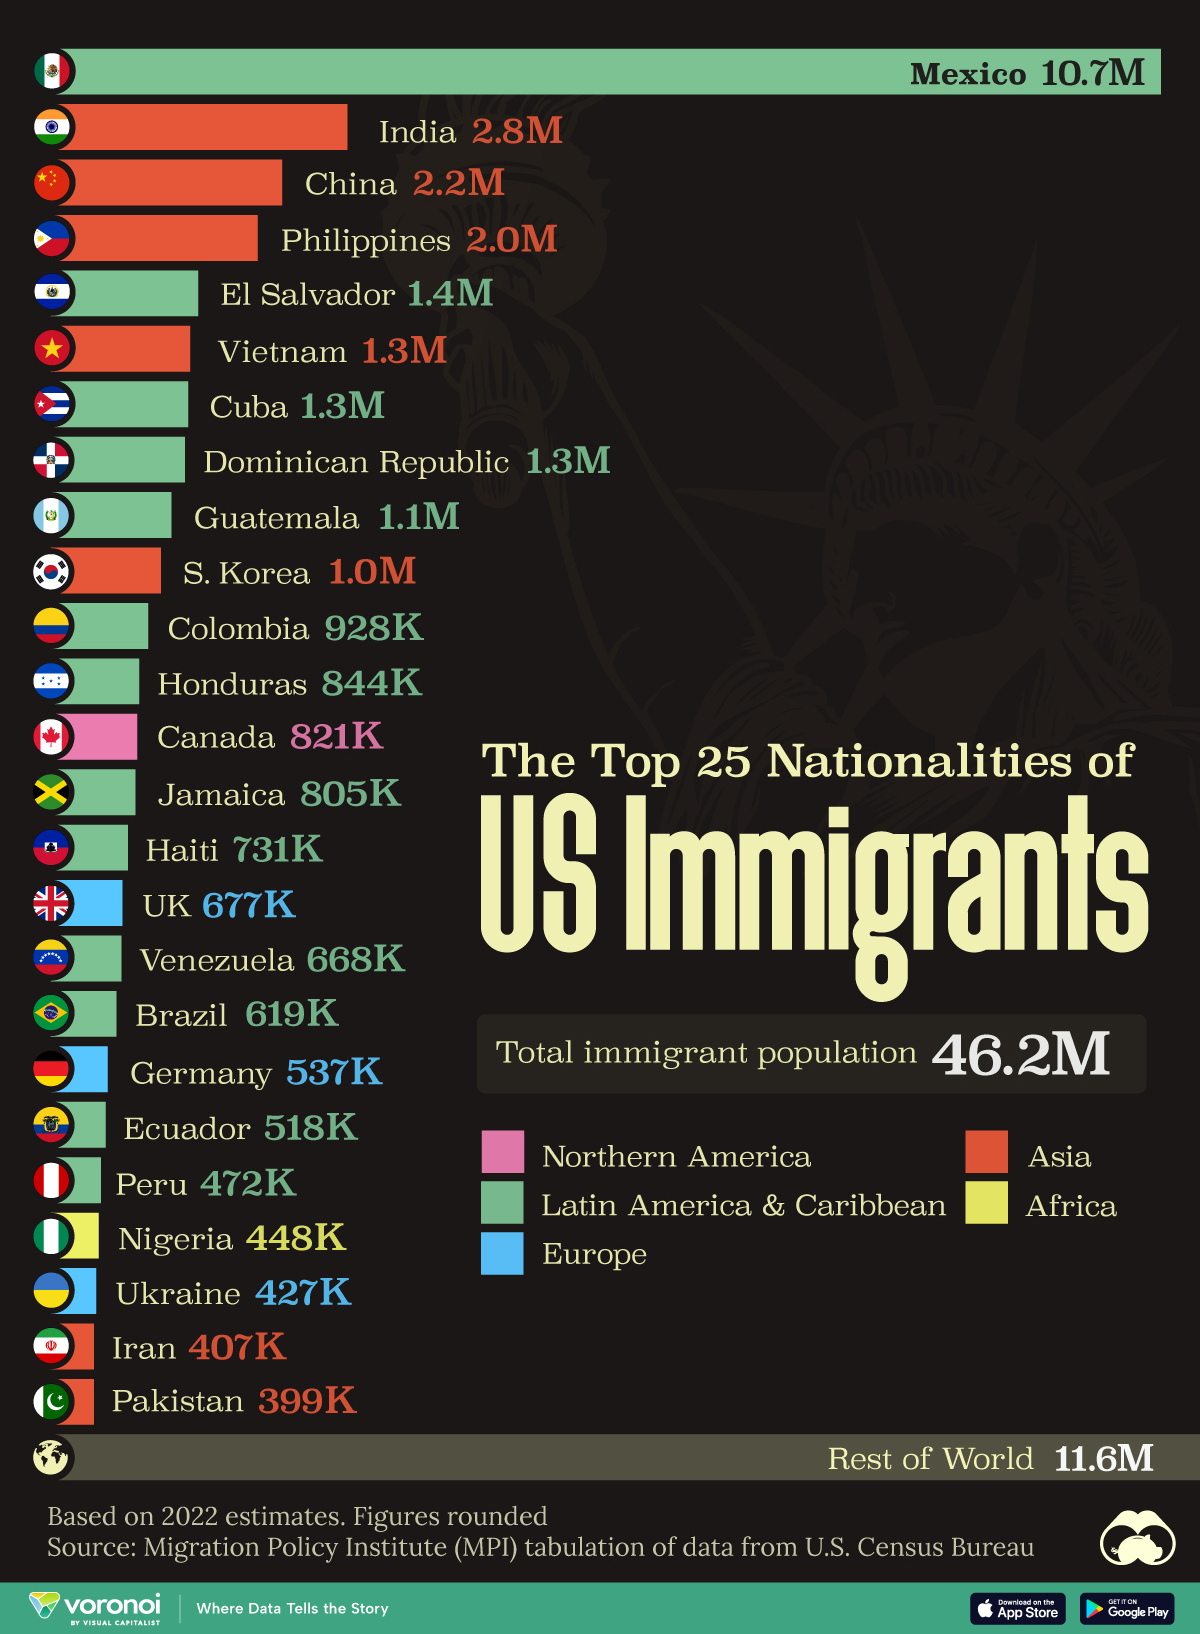
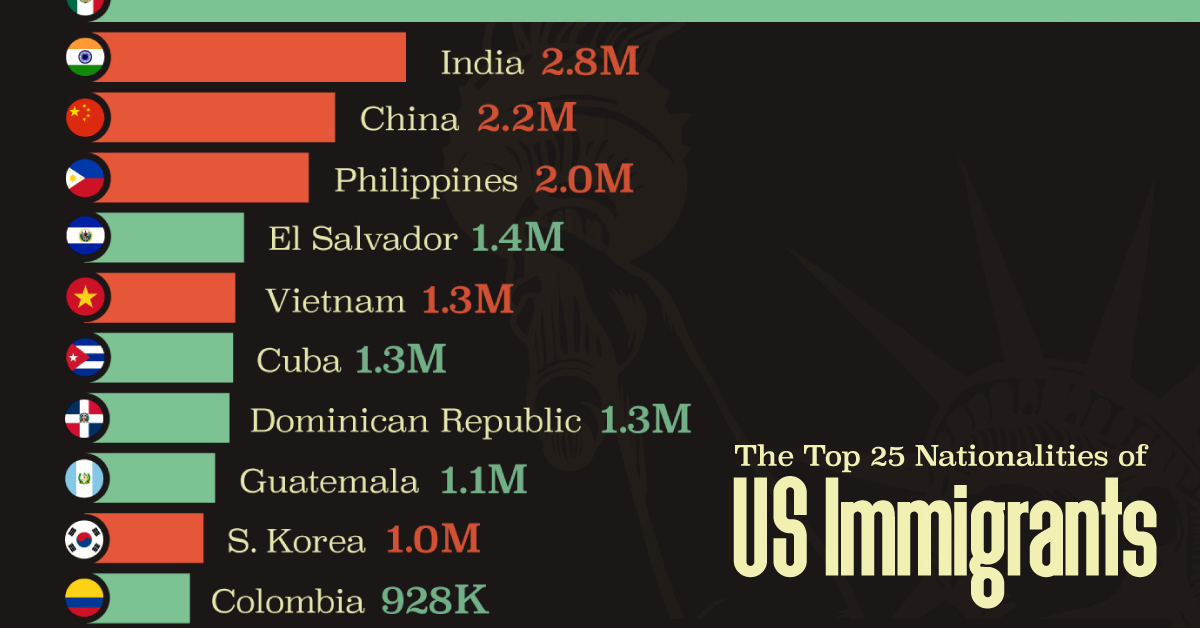
Mexico is the largest source of immigrants to the U.S., with almost 11 million immigrants.
The Top 25 Nationalities of U.S. Immigrants
This was originally posted on our Voronoi app. Download the app for free on iOS or Android and discover incredible data-driven charts from a variety of trusted sources.
The United States is home to more than 46 million immigrants, constituting approximately 14% of its total population.
This graphic displays the top 25 countries of origin for U.S. immigrants, based on 2022 estimates. The data is sourced from the Migration Policy Institute (MPI), which analyzed information from the U.S. Census Bureau’s 2022 American Community Survey.
In this context, “immigrants” refer to individuals residing in the United States who were not U.S. citizens at birth.
Mexico Emerges as a Leading Source of Immigration
Mexico stands out as the largest contributor to U.S. immigration due to its geographical proximity and historical ties.
Various economic factors, including wage disparities and employment opportunities, motivate many Mexicans to seek better prospects north of the border.
| Country | Region | # of Immigrants |
|---|---|---|
| 🇲🇽 Mexico | Latin America & Caribbean | 10,678,502 |
| 🇮🇳 India | Asia | 2,839,618 |
| 🇨🇳 China | Asia | 2,217,894 |
| 🇵🇭 Philippines | Asia | 1,982,333 |
| 🇸🇻 El Salvador | Latin America & Caribbean | 1,407,622 |
| 🇻🇳 Vietnam | Asia | 1,331,192 |
| 🇨🇺 Cuba | Latin America & Caribbean | 1,312,510 |
| 🇩🇴 Dominican Republic | Latin America & Caribbean | 1,279,900 |
| 🇬🇹 Guatemala | Latin America & Caribbean | 1,148,543 |
| 🇰🇷 Korea | Asia | 1,045,100 |
| 🇨🇴 Colombia | Latin America & Caribbean | 928,053 |
| 🇭🇳 Honduras | Latin America & Caribbean | 843,774 |
| 🇨🇦 Canada | Northern America | 821,322 |
| 🇯🇲 Jamaica | Latin America & Caribbean | 804,775 |
| 🇭🇹 Haiti | Latin America & Caribbean | 730,780 |
| 🇬🇧 United Kingdom | Europe | 676,652 |
| 🇻🇪 Venezuela | Latin America & Caribbean | 667,664 |
| 🇧🇷 Brazil | Latin America & Caribbean | 618,525 |
| 🇩🇪 Germany | Europe | 537,484 |
| 🇪🇨 Ecuador | Latin America & Caribbean | 518,287 |
| 🇵🇪 Peru | Latin America & Caribbean | 471,988 |
| 🇳🇬 Nigeria | Africa | 448,405 |
| 🇺🇦 Ukraine | Europe | 427,163 |
| 🇮🇷 Iran | Middle East | 407,283 |
| 🇵🇰 Pakistan | Asia | 399,086 |
| Rest of World | 11,637,634 | |
| Total | 46,182,089 |
Mexicans are followed in this ranking by Indians, Chinese, and Filipinos, though most immigrants on this list come from countries in the Latin American and Caribbean region.
On the other hand, only three European countries are among the top sources of U.S. immigrants: the UK, Germany, and Ukraine.
Immigration continues to be a significant factor contributing to the overall growth of the U.S. population. Overall population growth has decelerated over the past decade primarily due to declining birth rates.
Between 2021 and 2022, the increase in the immigrant population accounted for 65% of the total population growth in the U.S., representing 912,000 individuals out of nearly 1.4 million.
If you enjoyed this post, be sure to check out Visualized: Why Do People Immigrate to the U.S.? This visualization shows the different reasons cited by new arrivals to America in 2021.
-

 United States6 days ago
Mapped: Countries Where Recreational Cannabis is Legal
-
 Healthcare2 weeks ago
Life Expectancy by Region (1950-2050F)
-

 Markets2 weeks ago
The Growth of a $1,000 Equity Investment, by Stock Market
-

 Markets2 weeks ago
Mapped: Europe’s GDP Per Capita, by Country
-

 Money2 weeks ago
Charted: What Frustrates Americans About the Tax System
-

 Technology2 weeks ago
Countries With the Highest Rates of Crypto Ownership
-

 Mining2 weeks ago
Where the World’s Aluminum is Smelted, by Country
-

 Personal Finance1 week ago
Visualizing the Tax Burden of Every U.S. State

