Misc
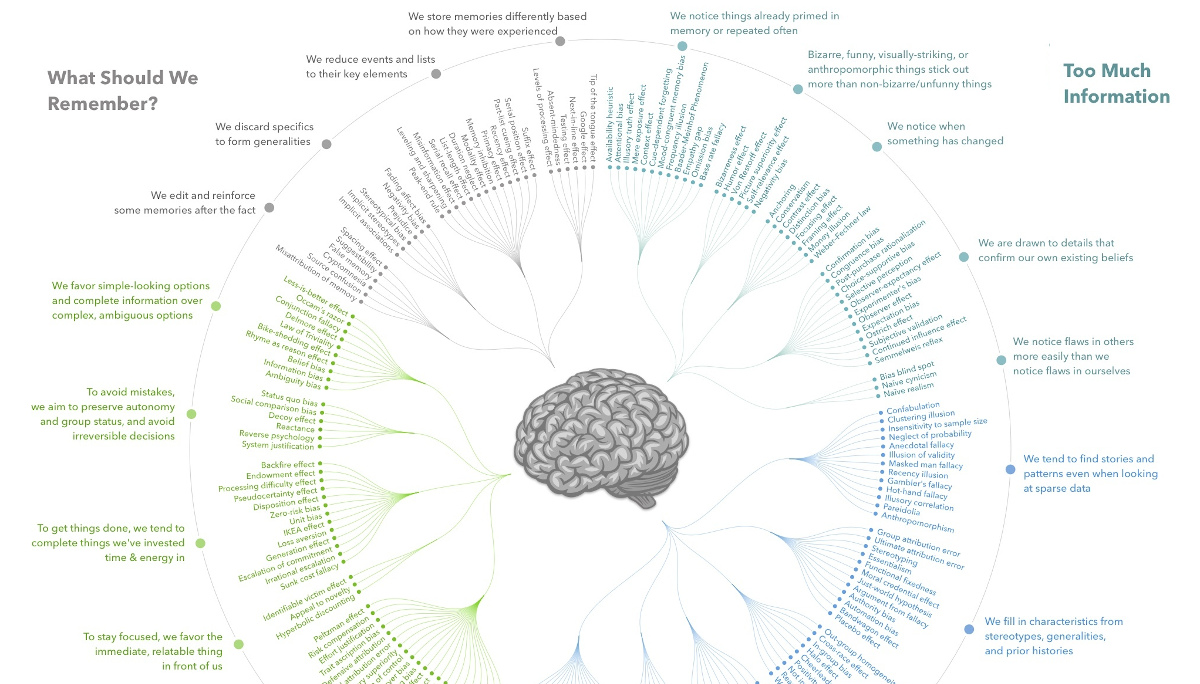
Every Single Cognitive Bias in One Infographic
View a high resolution version of this graphic
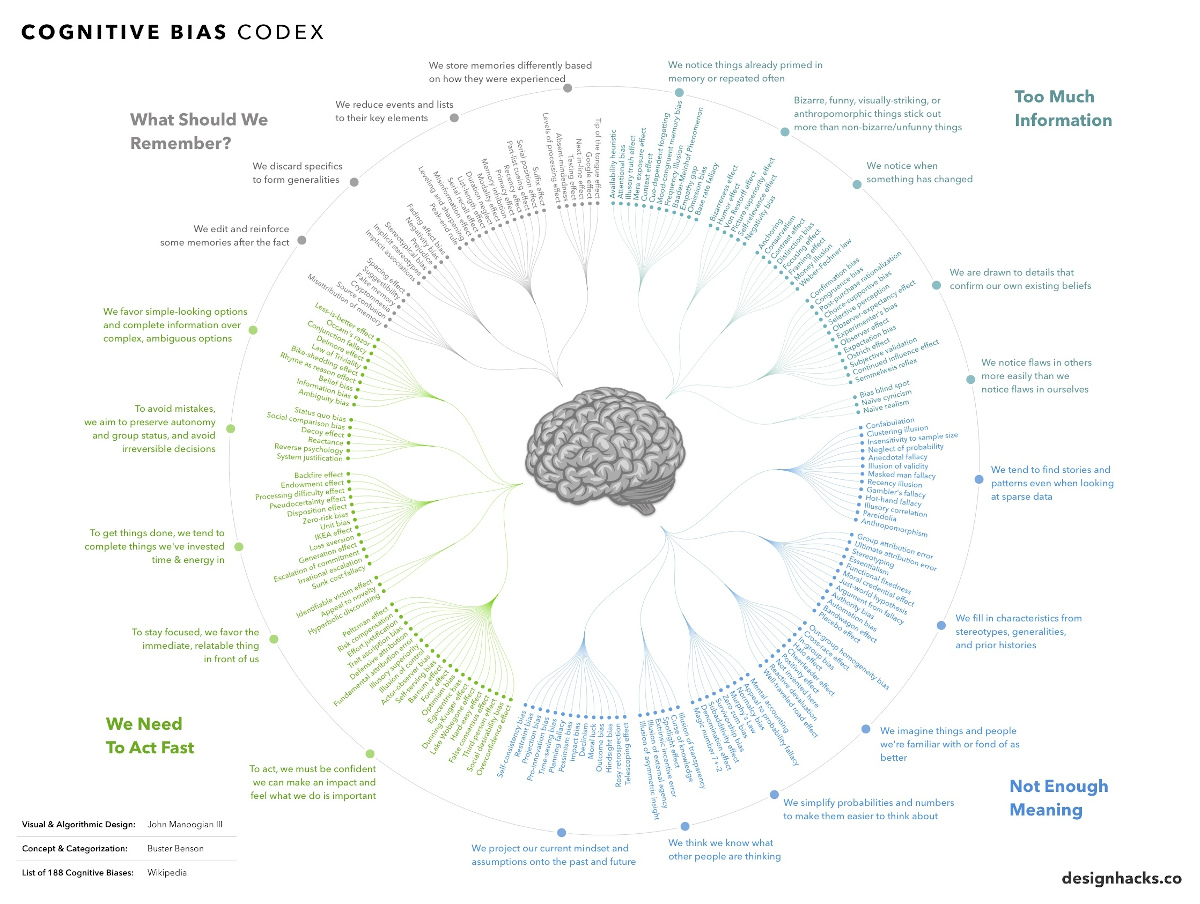
Every Single Cognitive Bias in One Infographic
View the high resolution version of today’s graphic by clicking here.
The human brain is capable of incredible things, but it’s also extremely flawed at times.
Science has shown that we tend to make all sorts of mental mistakes, called “cognitive biases”, that can affect both our thinking and actions. These biases can lead to us extrapolating information from the wrong sources, seeking to confirm existing beliefs, or failing to remember events the way they actually happened!
To be sure, this is all part of being human—but such cognitive biases can also have a profound effect on our endeavors, investments, and life in general.
For this reason, today’s infographic from DesignHacks.co is particularly handy. It shows and groups each of the 188 known confirmation biases in existence.
What is a Cognitive Bias?
Humans have a tendency to think in particular ways that can lead to systematic deviations from making rational judgments.
These tendencies usually arise from:
- Information processing shortcuts
- The limited processing ability of the brain
- Emotional and moral motivations
- Distortions in storing and retrieving memories
- Social influence
Cognitive biases have been studied for decades by academics in the fields of cognitive science, social psychology, and behavioral economics, but they are especially relevant in today’s information-packed world. They influence the way we think and act, and such irrational mental shortcuts can lead to all kinds of problems in entrepreneurship, investing, or management.
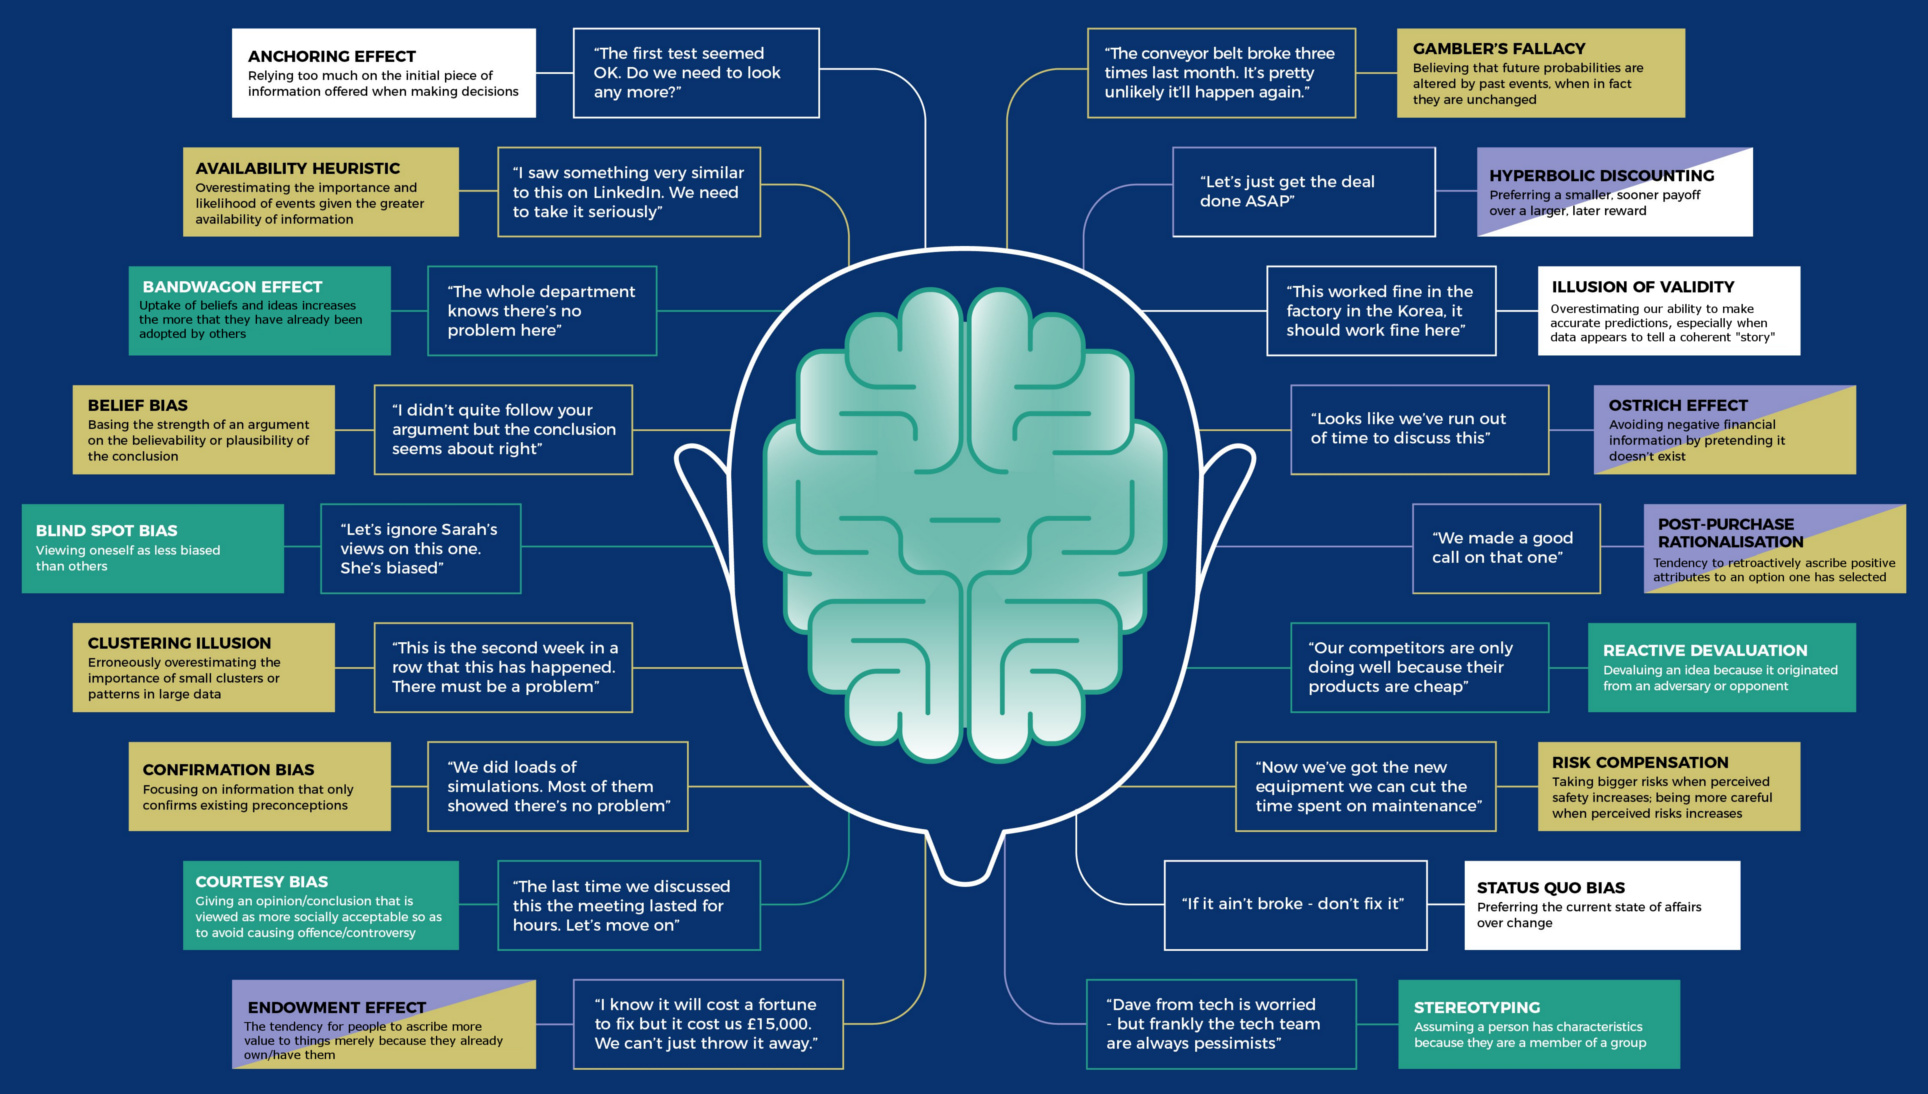
Cognitive Bias Examples
Here are five examples of how these types of biases can affect people in the business world:
1. Familiarity Bias: An investor puts her money in “what she knows”, rather than seeking the obvious benefits from portfolio diversification. Just because a certain type of industry or security is familiar doesn’t make it the logical selection.
2. Self-Attribution Bias: An entrepreneur overly attributes his company’s success to himself, rather than other factors (team, luck, industry trends). When things go bad, he blames these external factors for derailing his progress.
3. Anchoring Bias: An employee in a salary negotiation is too dependent on the first number mentioned in the negotiations, rather than rationally examining a range of options.
4. Survivorship Bias: Entrepreneurship looks easy, because there are so many successful entrepreneurs out there. However, this is a cognitive bias: the successful entrepreneurs are the ones still around, while the millions who failed went and did other things.
5. Gambler’s Fallacy: A venture capitalist sees a portfolio company rise and rise in value after its IPO, far behind what he initially thought possible. Instead of holding on to a winner and rationally evaluating the possibility that appreciation could still continue, he dumps the stock to lock in the existing gains.
This post was first published in 2017. We have since updated it, adding in new content for 2021.


Maps
Mapped: The 10 U.S. States With the Lowest Real GDP Growth
In this graphic, we show where real GDP lagged the most across America in 2023 as high interest rates weighed on state economies.


The Top 10 U.S. States, by Lowest Real GDP Growth
This was originally posted on our Voronoi app. Download the app for free on iOS or Android and discover incredible data-driven charts from a variety of trusted sources.
While the U.S. economy defied expectations in 2023, posting 2.5% in real GDP growth, several states lagged behind.
Last year, oil-producing states led the pack in terms of real GDP growth across America, while the lowest growth was seen in states that were more sensitive to the impact of high interest rates, particularly due to slowdowns in the manufacturing and finance sectors.
This graphic shows the 10 states with the least robust real GDP growth in 2023, based on data from the Bureau of Economic Analysis.
Weakest State Economies in 2023
Below, we show the states with the slowest economic activity in inflation-adjusted terms, using chained 2017 dollars:
| Rank | State | Real GDP Growth 2023 YoY | Real GDP 2023 |
|---|---|---|---|
| 1 | Delaware | -1.2% | $74B |
| 2 | Wisconsin | +0.2% | $337B |
| 3 | New York | +0.7% | $1.8T |
| 4 | Missississippi | +0.7% | $115B |
| 5 | Georgia | +0.8% | $661B |
| 6 | Minnesota | +1.2% | $384B |
| 7 | New Hampshire | +1.2% | $91B |
| 8 | Ohio | +1.2% | $698B |
| 9 | Iowa | +1.3% | $200B |
| 10 | Illinois | +1.3% | $876B |
| U.S. | +2.5% | $22.4T |
Delaware witnessed the slowest growth in the country, with real GDP growth of -1.2% over the year as a sluggish finance and insurance sector dampened the state’s economy.
Like Delaware, the Midwestern state of Wisconsin also experienced declines across the finance and insurance sector, in addition to steep drops in the agriculture and manufacturing industries.
America’s third-biggest economy, New York, grew just 0.7% in 2023, falling far below the U.S. average. High interest rates took a toll on key sectors, with notable slowdowns in the construction and manufacturing sectors. In addition, falling home prices and a weaker job market contributed to slower economic growth.
Meanwhile, Georgia experienced the fifth-lowest real GDP growth rate. In March 2024, Rivian paused plans to build a $5 billion EV factory in Georgia, which was set to be one of the biggest economic development initiatives in the state in history.
These delays are likely to exacerbate setbacks for the state, however, both Kia and Hyundai have made significant investments in the EV industry, which could help boost Georgia’s manufacturing sector looking ahead.

-

 Technology1 week ago
Countries With the Highest Rates of Crypto Ownership
-

 Mining6 days ago
Visualizing Copper Production by Country in 2023
-

 Politics7 days ago
Charted: How Americans Feel About Federal Government Agencies
-

 Healthcare1 week ago
Which Countries Have the Highest Infant Mortality Rates?
-

 Demographics1 week ago
Mapped: U.S. Immigrants by Region
-

 Economy1 week ago
Mapped: Southeast Asia’s GDP Per Capita, by Country
-

 Automotive1 week ago
How People Get Around in America, Europe, and Asia
-

 Personal Finance1 week ago
Visualizing the Tax Burden of Every U.S. State