Introducing some of the best data storytellers from around the world. Read about them and how you can support their work
Neil Richards
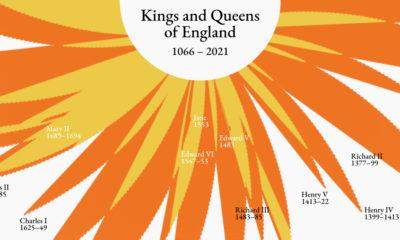
Geometric, Unconventional, Design Driven
Neil is a four time Tableau Visionary (formerly known as Zen Master), a data visualisation hobbyist, blogger, professional, and speaker. He is a Director of Viz For Social Good (vizforsocialgood.com), and former director of the Data Visualization Society. He enjoys creating data art pieces and promotes the ethos of design driven data, exploring a wide range of visualisation types and taking influence from art, design, nature, and other unconventional sources. Visualisation topics may range from history through sport, mathematics, art, culture, and geopolitics, but are rarely serious. Neil's first book Questions in Dataviz is due to be released in 2022.