Green
Mapped: Carbon Pricing Initiatives Around the World
Article/Editing:
Click to view this graphic in a higher-resolution.
Mapped: Carbon Pricing Initiatives Around the World
Over the past two decades, governments around the world have responded to climate change through various initiatives and policies, with carbon pricing at the forefront.
A recent example is the Canadian province of Ontario’s Emissions Performance Standards program, first launched in 2022. The program sets annual carbon emissions limits for industrial facilities, with a fee on excess carbon emitted.
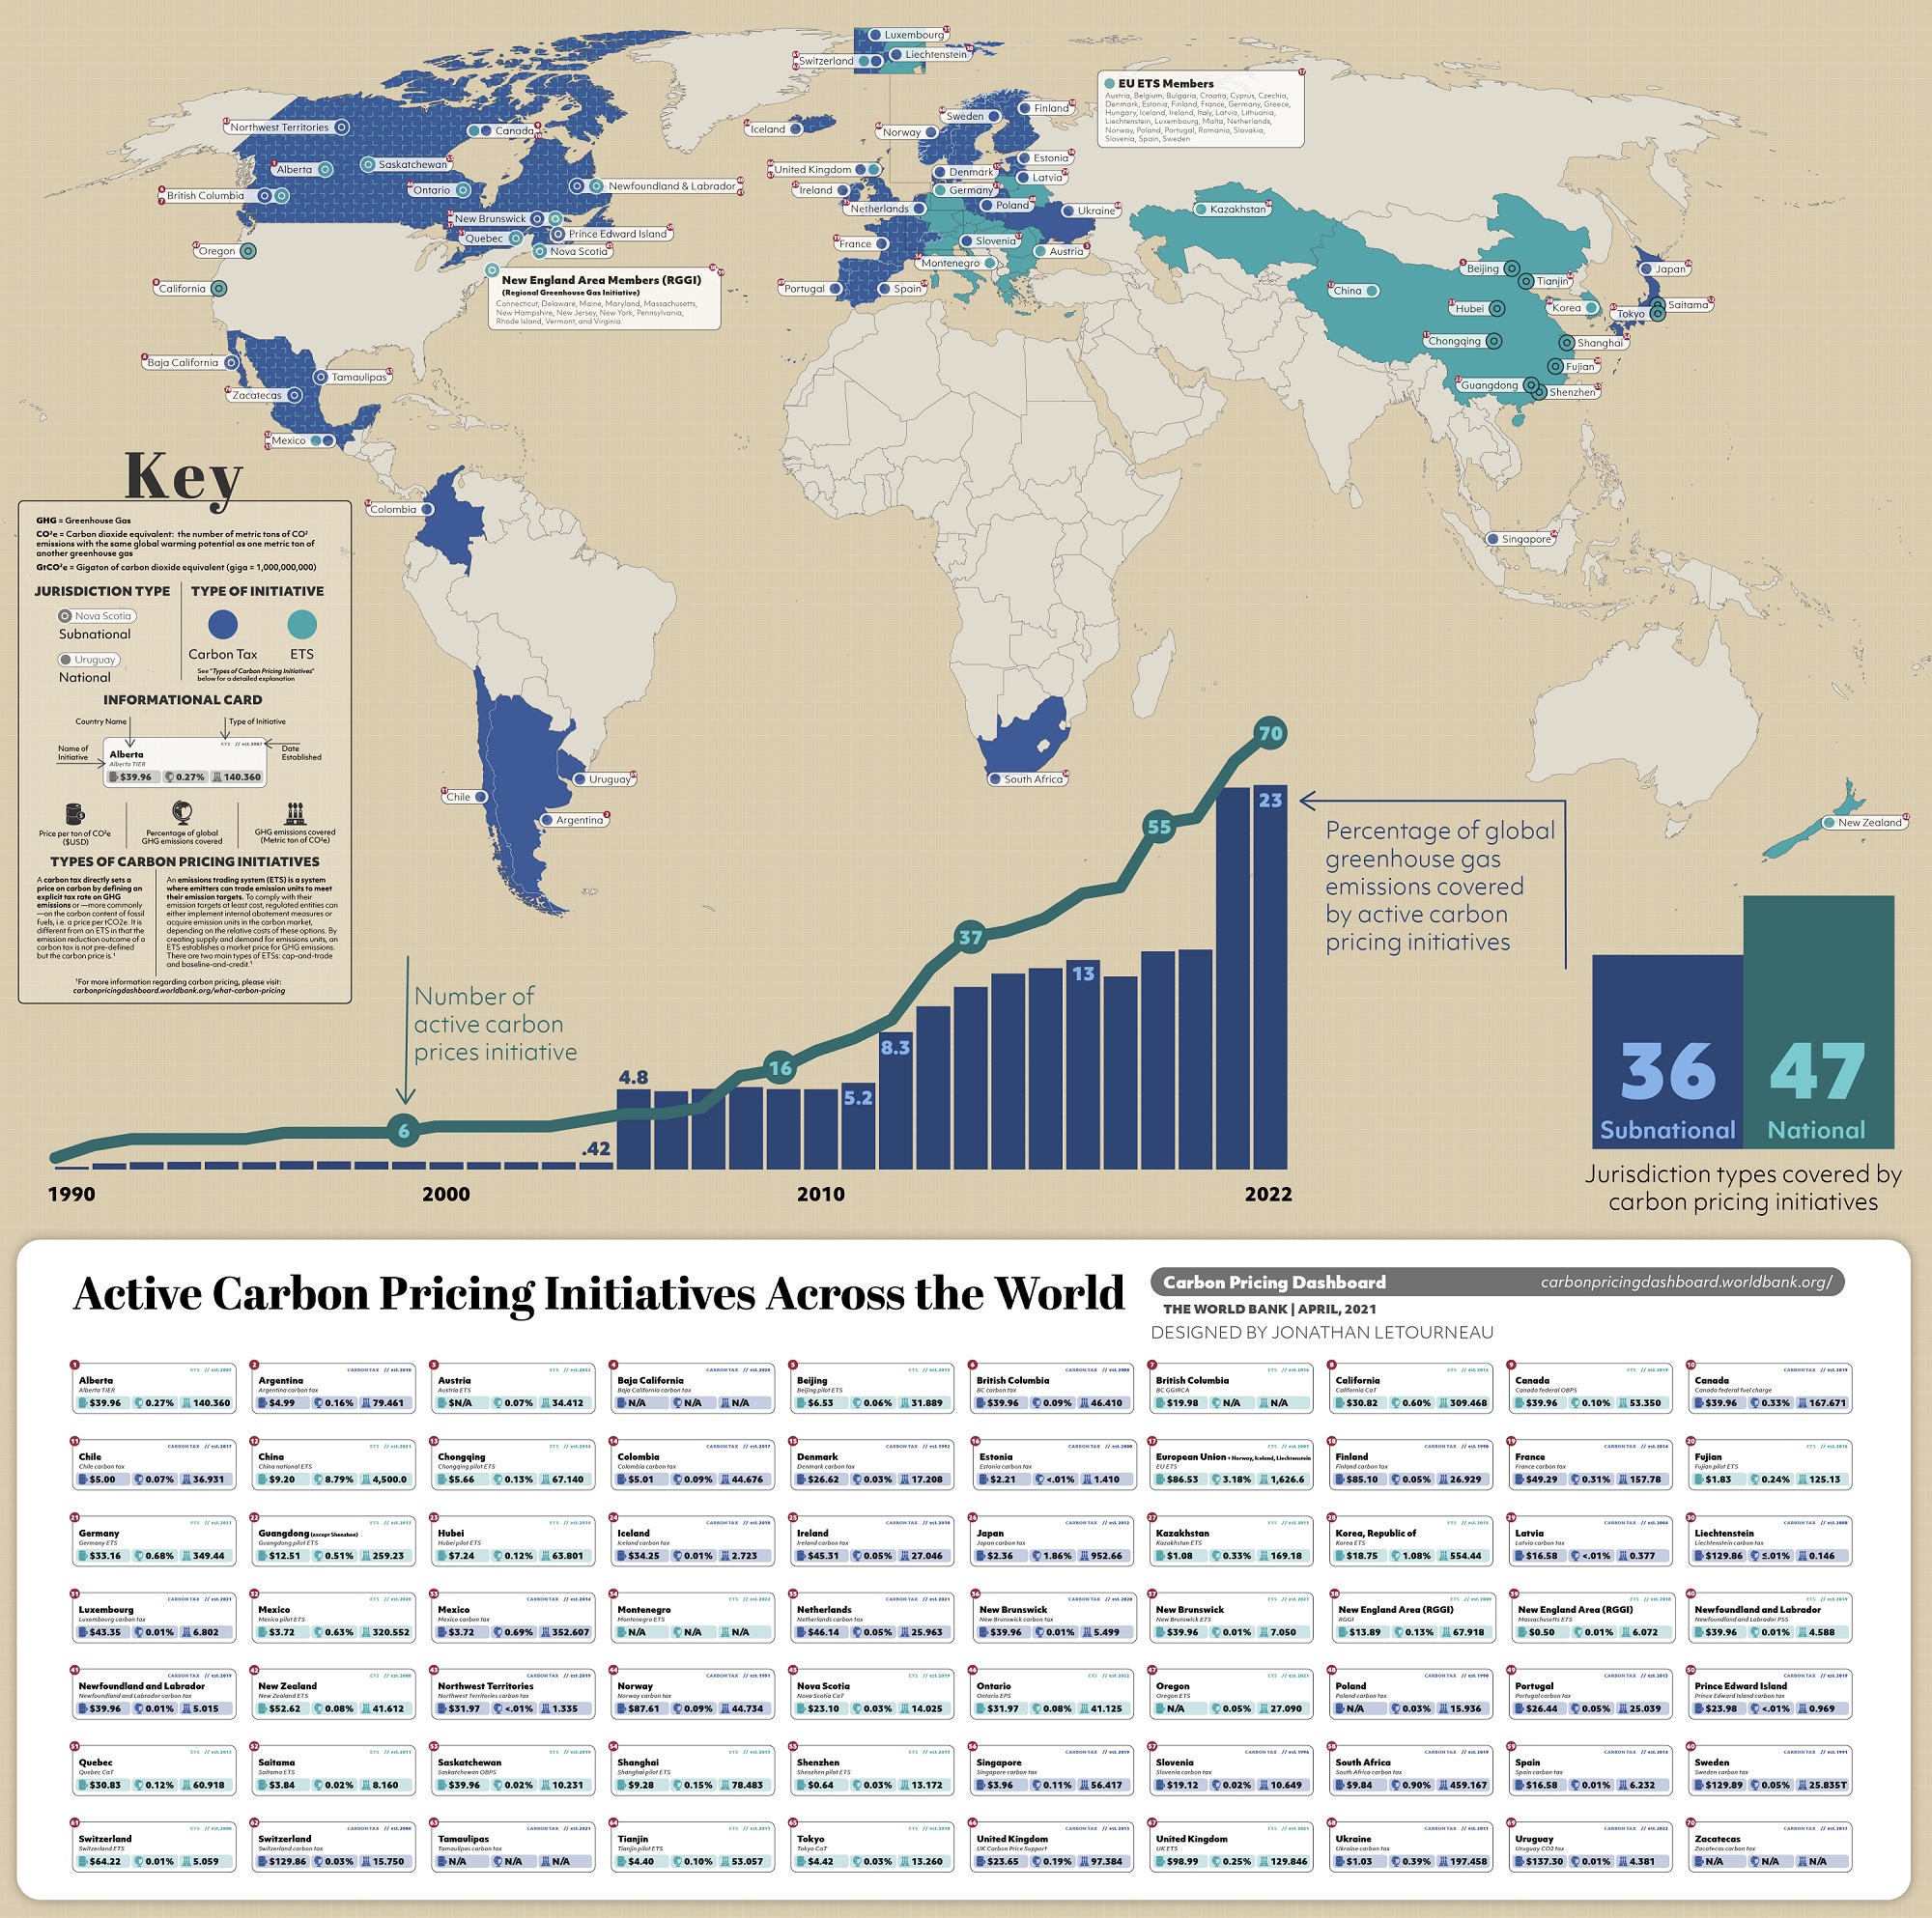
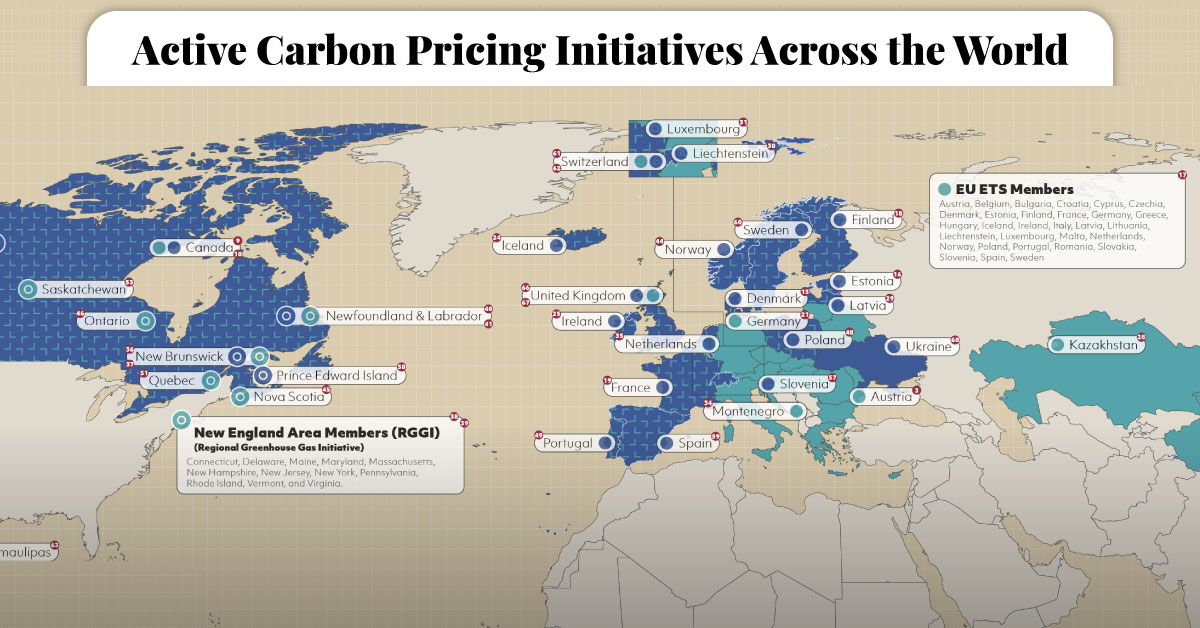
This graphic by Jonathan Letourneau maps 70 active carbon pricing initiatives around the world and highlights their global impact as seen in the 2022 World Bank report.
But first, let’s look at the different types of carbon pricing:
Carbon Tax vs. ETS
Broadly speaking, carbon pricing gives emission generating organizations a choice between reducing their carbon emissions and paying for them.
The two typical initiatives used to offer this choice are carbon taxes and emissions trading systems (ETS):
- Carbon tax: This tax or levy is directly applied to the production of carbon emissions or fuels that release greenhouse gases. This makes products or services that release substantial carbon more expensive than greener alternatives (or reducing emissions).
- Emissions Trading System (ETS): Also called the cap-and-trade system, ETS puts a cap on the total level of greenhouse gases a licensed industry can emit. Companies with low emissions can sell their unused emission allowance with larger emitters that have exceeded the cap.
The World’s Carbon Pricing Initiatives
As of the end of 2022, Europe was home to 24 of the 70 active carbon pricing initiatives in the world.
| Location | Carbon Pricing Type | CO2e Price Per Tonne (USD) | Emissions Covered (Tonnes) |
|---|---|---|---|
| 🇦🇷 Argentina | Carbon tax | $4.99 | 79.46 |
| 🇦🇹 Austria | ETS | N/A | 34.41 |
| 🇨🇦 Canada | ETS | $39.96 | 53.35 |
| 🇨🇦 Canada | Carbon tax | $39.96 | 167.67 |
| 🇨🇦 Canada - Alberta | ETS | $39.96 | 140.36 |
| 🇨🇦 Canada - British Columbia | ETS | $19.98 | N/A |
| 🇨🇦 Canada - British Columbia | Carbon tax | $39.96 | 46.41 |
| 🇨🇦 Canada - New Brunswick | ETS | $39.96 | 7.05 |
| 🇨🇦 Canada - New Brunswick | Carbon tax | $39.96 | 5.50 |
| 🇨🇦 Canada - Newfoundland and Labrador | ETS | $39.96 | 4.59 |
| 🇨🇦 Canada - Newfoundland and Labrador | Carbon tax | $39.96 | 5.01 |
| 🇨🇦 Canada - Northwest Territories | Carbon tax | $31.97 | 1.33 |
| 🇨🇦 Canada - Nova Scotia | ETS | $23.10 | 14.02 |
| 🇨🇦 Canada - Ontario | ETS | $31.97 | 41.12 |
| 🇨🇦 Canada - Prince Edward Island | Carbon tax | $23.98 | 0.97 |
| 🇨🇦 Canada - Quebec | ETS | $30.83 | 60.92 |
| 🇨🇦 Canada - Saskatchewan | ETS | $39.96 | 10.23 |
| 🇨🇱 Chile | Carbon tax | $5.00 | 36.93 |
| 🇨🇳 China | ETS | $9.20 | 4,500.00 |
| 🇨🇳 China - Beijing | ETS | $6.53 | 31.89 |
| 🇨🇳 China - Chongqing | ETS | $5.66 | 67.14 |
| 🇨🇳 China - Fujian | ETS | $1.83 | 125.13 |
| 🇨🇳 China - Guangdong (except Shenzhen) | ETS | $12.51 | 259.23 |
| 🇨🇳 China - Hubei | ETS | $7.24 | 63.80 |
| 🇨🇳 China - Shanghai | ETS | $9.28 | 78.48 |
| 🇨🇳 China - Shenzhen | ETS | $0.64 | 13.17 |
| 🇨🇳 China - Tianjin | ETS | $4.40 | 53.08 |
| 🇨🇴 Colombia | Carbon tax | $5.01 | 44.68 |
| 🇩🇰 Denmark | Carbon tax | $26.62 | 17.21 |
| 🇪🇪 Estonia | Carbon tax | $2.21 | 1.41 |
| 🇪🇺 EU - Norway, Iceland, Liechtenstein | ETS | $86.53 | 1,626.60 |
| 🇫🇮 Finland | Carbon tax | $85.10 | 26.93 |
| 🇫🇷 France | Carbon tax | $49.29 | 157.78 |
| 🇩🇪 Germany | ETS | $33.16 | 349.44 |
| 🇮🇸 Iceland | Carbon tax | $34.25 | 2.72 |
| 🇮🇪 Ireland | Carbon tax | $45.31 | 27.05 |
| 🇯🇵 Japan | Carbon tax | $2.36 | 952.66 |
| 🇯🇵 Japan - Saitama | ETS | $3.84 | 8.16 |
| 🇯🇵 Japan - Tokyo | ETS | $4.42 | 13.26 |
| 🇰🇿 Kazakhstan | ETS | $1.08 | 169.18 |
| 🇰🇷 Korea, Republic of | ETS | $18.75 | 554.44 |
| 🇱🇻 Latvia | Carbon tax | $16.58 | 0.38 |
| 🇱🇮 Liechtenstein | Carbon tax | $129.86 | 0.15 |
| 🇱🇺 Luxembourg | Carbon tax | $43.35 | 6.80 |
| 🇲🇽 Mexico | Carbon tax | $3.72 | 352.61 |
| 🇲🇽 Mexico | ETS | $3.72 | 320.55 |
| 🇲🇽 Mexico - Baja California | Carbon tax | N/A | N/A |
| 🇲🇽 Mexico - Tamaulipas | Carbon tax | N/A | N/A |
| 🇲🇽 Mexico - Zacatecas | Carbon tax | N/A | N/A |
| 🇲🇪 Montenegro | ETS | N/A | N/A |
| 🇳🇱 Netherlands | Carbon tax | $46.14 | 25.96 |
| 🇳🇿 New Zealand | ETS | $52.62 | 41.61 |
| 🇳🇴 Norway | Carbon tax | $87.61 | 44.73 |
| 🇵🇱 Poland | Carbon tax | N/A | 15.94 |
| 🇵🇹 Portugal | Carbon tax | $26.44 | 25.04 |
| 🇸🇬 Singapore | Carbon tax | $3.96 | 56.42 |
| 🇸🇮 Slovenia | Carbon tax | $19.12 | 10.65 |
| 🇿🇦 South Africa | Carbon tax | $9.84 | 459.17 |
| 🇪🇸 Spain | Carbon tax | $16.58 | 6.23 |
| 🇸🇪 Sweden | Carbon tax | $129.89 | 25.83 |
| 🇨🇭 Switzerland | ETS | $64.22 | 5.06 |
| 🇨🇭 Switzerland | Carbon tax | $129.86 | 15.75 |
| 🇺🇸 United States - California | ETS | $30.82 | 309.47 |
| 🇺🇸 United States - New England Area (RGGI) | ETS | $13.89 | 67.92 |
| 🇺🇸 United States - New England Area (RGGI) | ETS | $0.50 | 6.07 |
| 🇺🇸 United States - Oregon | ETS | N/A | 27.09 |
| 🇺🇦 Ukraine | Carbon tax | $1.03 | 197.46 |
| 🇬🇧 United Kingdom | Carbon tax | $23.65 | 97.38 |
| 🇬🇧 United Kingdom | ETS | $98.99 | 129.85 |
| 🇺🇾 Uruguay | Carbon tax | $137.30 | 4.38 |
Europe’s position is not surprising given many of its countries have set ambitious carbon neutral goals. The region’s European Union Emissions Trading System (EU ETS) is the world’s largest carbon market, covering 1.8 billion tonnes of emissions annually.
Canada has also implemented numerous regional and national carbon pricing initiatives, with many provinces falling under both main types of carbon pricing. For example, carbon emissions in British Columbia—the first jurisdiction in North America to implement carbon pricing—are priced under both a carbon tax and an ETS.
Meanwhile, the world’s largest emitter of greenhouse gases in 2021, China, implemented its much-awaited national ETS the same year. In just one year, the country’s traded carbon emission allowances crossed 200 million tonnes.
In the U.S., several states have implemented their own carbon pricing initiatives. California’s cap-and-trade initiative covers emissions from electricity, transportation, and industry, while the Regional Greenhouse Gas Initiative sets a cap on emissions from power plants of nine Northeastern states, including New York, Massachusetts, and Pennsylvania.
The Impact of Carbon Pricing
Putting a price on carbon emissions seems to have made an impact in reducing emissions.
In Europe, the EU ETS has helped reduce emissions from the power sector by 43% in the region since its inception in 2005.
Likewise, California’s Cap-and-Trade program has helped the state meet its goal of reducing carbon emissions back to 1990 levels.
In many jurisdictions, including China and Canada, there are plans to double down on carbon pricing plans, either by increasing the cost of carbon or lowering emissions limits.
But while many economists and policy makers have found carbon pricing to be the most efficient tool to curb emissions, they also point out that the programs themselves need to be designed well. Initiatives with limits that are too high or prices that are too low can be ineffectual, as well as giving certain major polluters exemptions from programs.

This article was published as a part of Visual Capitalist's Creator Program, which features data-driven visuals from some of our favorite Creators around the world.


Automotive
How People Get Around in America, Europe, and Asia
Examining how people get around using cars, public transit, and walking or biking, and the regional differences in usage.


How People Get Around in America, Europe, and Asia
This was originally posted on our Voronoi app. Download the app for free on iOS or Android and discover incredible data-driven charts from a variety of trusted sources.
This chart highlights the popularity of different transportation types in the Americas, Europe, and Asia, calculated by modal share.
Data for this article and visualization is sourced from ‘The ABC of Mobility’, a research paper by Rafael Prieto-Curiel (Complexity Science Hub) and Juan P. Ospina (EAFIT University), accessed through ScienceDirect.
The authors gathered their modal share data through travel surveys, which focused on the primary mode of transportation a person employs for each weekday trip. Information from 800 cities across 61 countries was collected for this study.
North American Car Culture Contrasts with the Rest of the World
In the U.S. and Canada, people heavily rely on cars to get around, no matter the size of the city. There are a few exceptions of course, such as New York, Toronto, and smaller college towns across the United States.
| Region | 🚗 Cars | 🚌 Public Transport | 🚶 Walking/Biking |
|---|---|---|---|
| North America* | 92% | 5% | 4% |
| Central America | 23% | 42% | 35% |
| South America | 29% | 40% | 31% |
| Northern Europe | 48% | 29% | 24% |
| Western Europe | 43% | 24% | 34% |
| Southern Europe | 50% | 24% | 25% |
| Eastern Europe | 35% | 40% | 25% |
| Southeastern Asia | 44% | 43% | 13% |
| Western Asia | 43% | 28% | 29% |
| Southern Asia | 22% | 39% | 39% |
| Eastern Asia | 19% | 46% | 35% |
| World | 51% | 26% | 22% |
Note: *Excluding Mexico. Percentages are rounded.
As a result, North America’s share of public transport and active mobility (walking and biking) is the lowest amongst all surveyed regions by a significant amount.
On the other hand, public transport reigns supreme in South and Central America as well as Southern and Eastern Asia. It ties with cars in Southeastern Asia, and is eclipsed by cars in Western Asia.
As outlined in the paper, Europe sees more city-level differences in transport popularity.
For example, Utrecht, Netherlands prefers walking and biking. People in Paris and London like using their extensive transit systems. And in Manchester and Rome, roughly two out of three journeys are by car.

-

 Technology6 days ago
Countries With the Highest Rates of Crypto Ownership
-

 Mining2 weeks ago
Visualizing Global Gold Production in 2023
-

 Markets2 weeks ago
Visualized: Interest Rate Forecasts for Advanced Economies
-

 Economy2 weeks ago
The Most Valuable Companies in Major EU Economies
-

 Markets2 weeks ago
The World’s Fastest Growing Emerging Markets (2024-2029 Forecast)
-

 Markets1 week ago
Visualizing Global Inflation Forecasts (2024-2026)
-

 Misc1 week ago
Charted: What Southeast Asia Thinks About China & the U.S.
-

 Misc1 week ago
The Evolution of U.S. Beer Logos