Countries
Charted: The World’s Biggest Oil Producers


Charted: The World’s Biggest Oil Producers in 2022
In 2022 oil prices peaked at more than $100 per barrel, hitting an eight-year high, after a full year of turmoil in the energy markets in the wake of the Russian invasion of Ukraine.
Oil companies doubled their profits and the economies of the biggest oil producers in the world got a major boost.
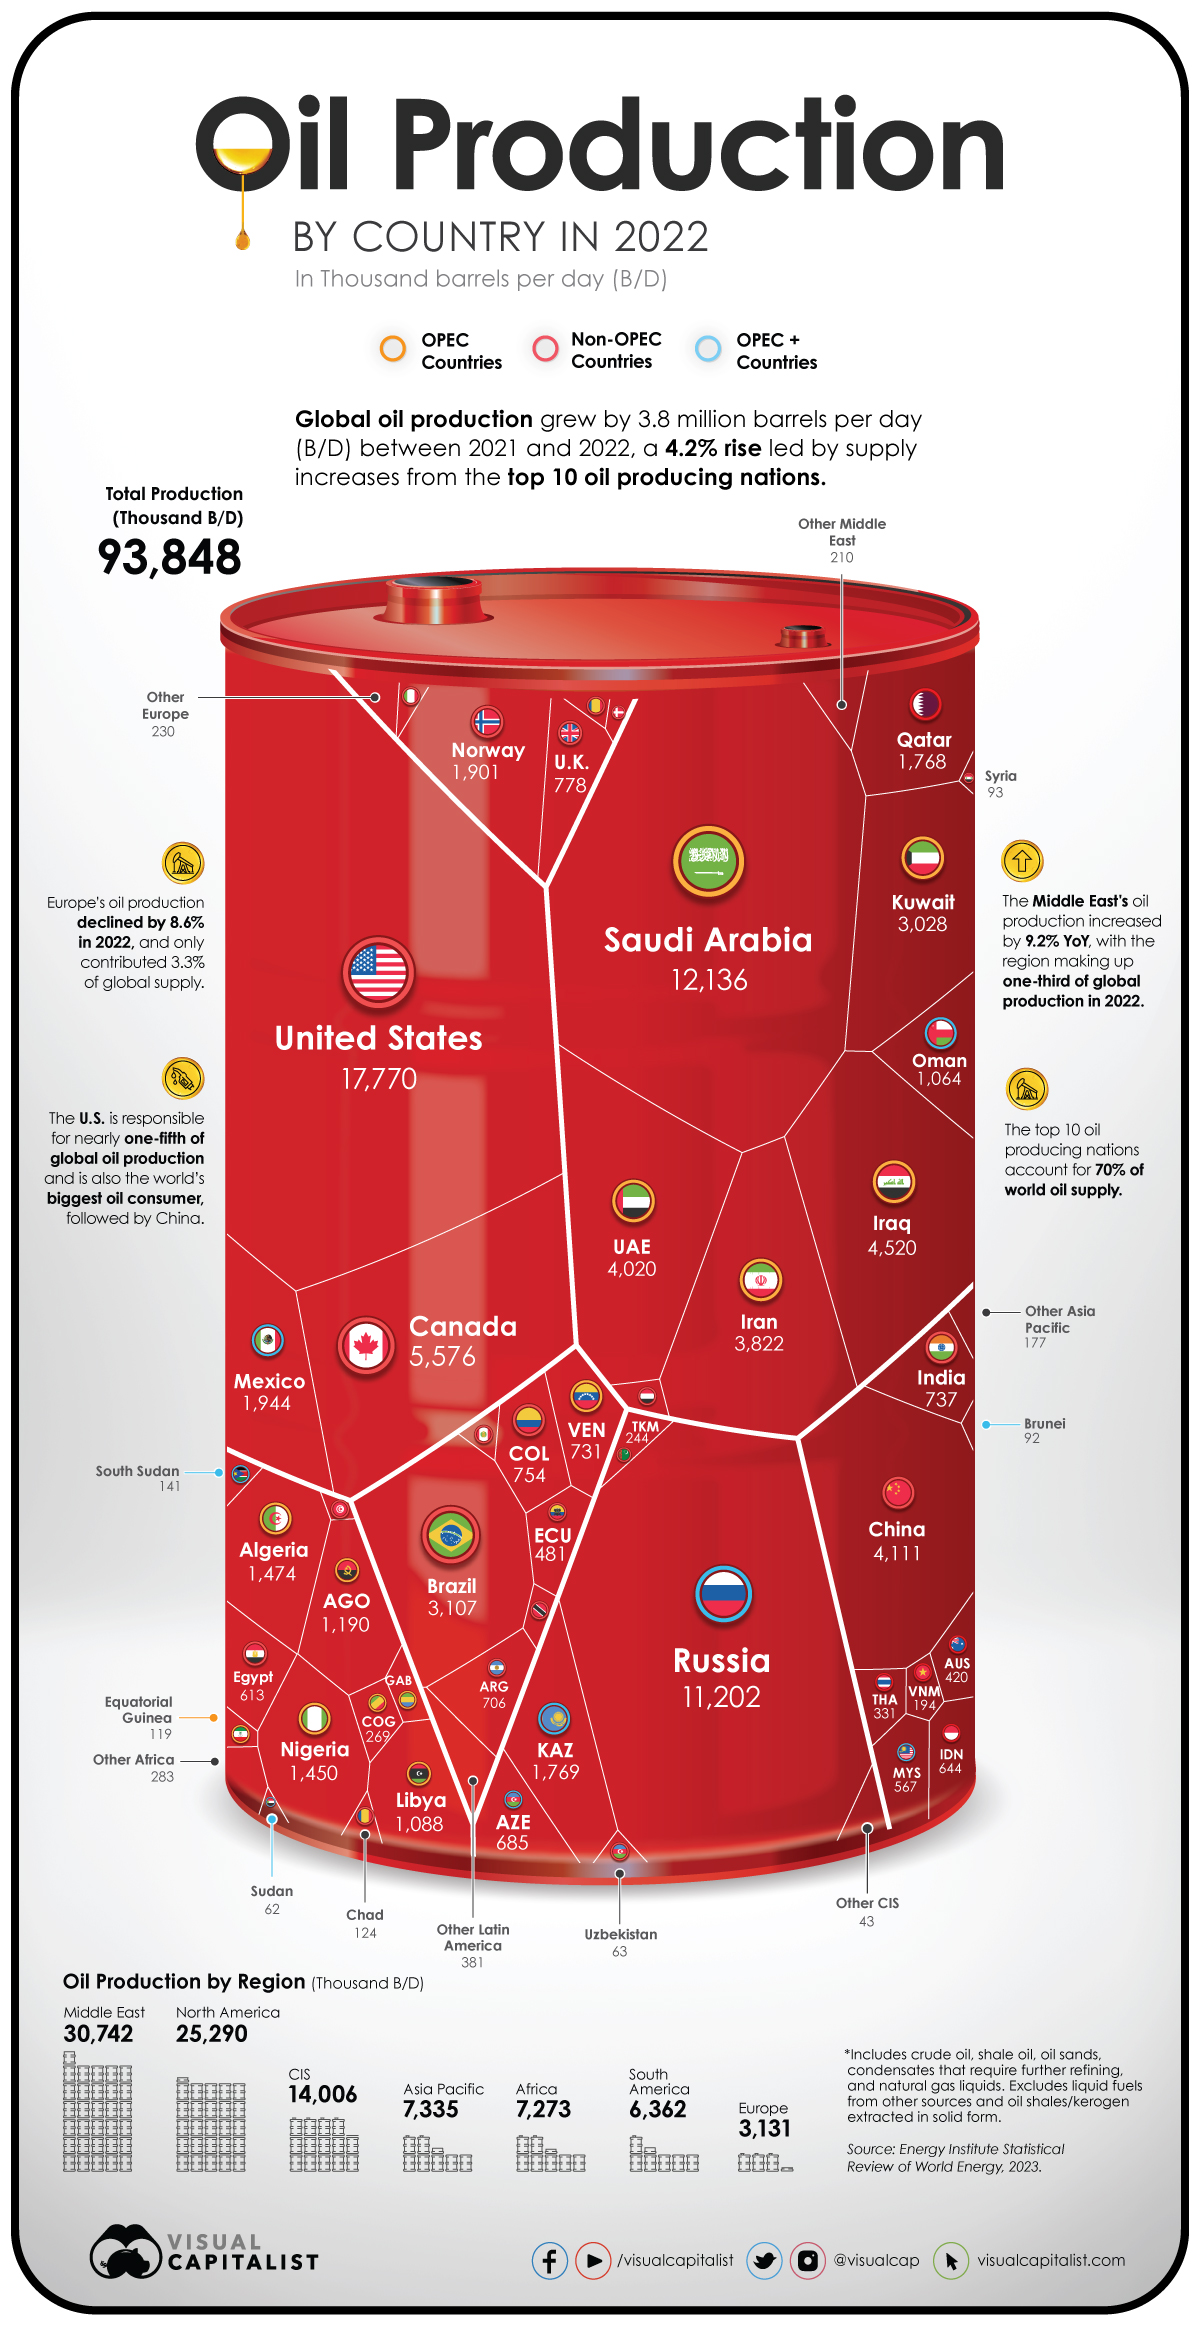
But which countries are responsible for most of the world’s oil supply? Using data from the Statistical Review of World Energy by the Energy Institute, we’ve visualized and ranked the world’s biggest oil producers.
Ranked: Oil Production By Country, in 2022
The U.S. has been the world’s biggest oil producer since 2018 and continued its dominance in 2022 by producing close to 18 million barrels per day (B/D). This accounted for nearly one-fifth of the world’s oil supply.
Almost three-fourths of the country’s oil production is centered around five states: Texas, New Mexico, North Dakota, Alaska, and Colorado.
We rank the other major oil producers in the world below.
| Rank | Country | 2022 Production (Thousand B/D) | YoY Change | Share of World Supply |
|---|---|---|---|---|
| 1 | 🇺🇸 U.S. | 17,770 | +6.5% | 18.9% |
| 2 | 🇸🇦 Saudi Arabia | 12,136 | +10.8% | 12.9% |
| 3 | 🇷🇺 Russia | 11,202 | +1.8% | 11.9% |
| 4 | 🇨🇦 Canada | 5,576 | +3.0% | 5.9% |
| 5 | 🇮🇶 Iraq | 4,520 | +10.2% | 4.8% |
| 6 | 🇨🇳 China | 4,111 | +2.9% | 4.4% |
| 7 | 🇦🇪 UAE | 4,020 | +10.4% | 4.3% |
| 8 | 🇮🇷 Iran | 3,822 | +4.6% | 4.1% |
| 9 | 🇧🇷 Brazil | 3,107 | +3.9% | 3.3% |
| 10 | 🇰🇼 Kuwait | 3,028 | +12.0% | 3.2% |
| 11 | 🇲🇽 Mexico | 1,944 | +0.9% | 2.1% |
| 12 | 🇳🇴 Norway | 1,901 | -6.3% | 2.0% |
| 13 | 🇰🇿 Kazakhstan | 1,769 | -2.0% | 1.9% |
| 14 | 🇶🇦 Qatar | 1,768 | +1.8% | 1.9% |
| 15 | 🇩🇿 Algeria | 1,474 | +8.9% | 1.6% |
| 16 | 🇳🇬 Nigeria | 1,450 | -11.2% | 1.5% |
| 17 | 🇦🇴 Angola | 1,190 | +1.1% | 1.3% |
| 18 | 🇱🇾 Libya | 1,088 | -14.3% | 1.2% |
| 19 | 🇴🇲 Oman | 1,064 | +9.6% | 1.1% |
| 20 | 🇬🇧 UK | 778 | -11.0% | 0.8% |
| 21 | 🇨🇴 Colombia | 754 | +2.4% | 0.8% |
| 22 | 🇮🇳 India | 737 | -3.8% | 0.8% |
| 23 | 🇻🇪 Venezuela | 731 | +8.1% | 0.8% |
| 24 | 🇦🇷 Argentina | 706 | +12.4% | 0.8% |
| 25 | 🇦🇿 Azerbaijan | 685 | -5.6% | 0.7% |
| 26 | 🇮🇩 Indonesia | 644 | -6.9% | 0.7% |
| 27 | 🇪🇬 Egypt | 613 | +0.8% | 0.7% |
| 28 | 🇲🇾 Malaysia | 567 | -1.7% | 0.6% |
| 29 | 🇪🇨 Ecuador | 481 | +1.7% | 0.5% |
| 30 | 🇦🇺 Australia | 420 | -5.2% | 0.4% |
| 31 | 🇹🇭 Thailand | 331 | -17.5% | 0.4% |
| 32 | 🇨🇩 Congo | 269 | -1.7% | 0.3% |
| 33 | 🇹🇲 Turkmenistan | 244 | +1.0% | 0.3% |
| 34 | 🇻🇳 Vietnam | 194 | -1.2% | 0.2% |
| 35 | 🇬🇦 Gabon | 191 | +5.4% | 0.2% |
| 36 | 🇸🇸 South Sudan | 141 | -7.6% | 0.2% |
| 37 | 🇵🇪 Peru | 128 | +0.5% | 0.1% |
| 38 | 🇹🇩 Chad | 124 | +6.2% | 0.1% |
| 39 | 🇬🇶 Equatorial Guinea | 119 | -9.2% | 0.1% |
| 40 | 🇸🇾 Syria | 93 | -2.7% | 0.1% |
| 41 | 🇮🇹 Italy | 92 | -7.9% | 0.1% |
| 42 | 🇧🇳 Brunei | 92 | -13.8% | 0.1% |
| 43 | 🇾🇪 Yemen | 81 | -2.4% | 0.1% |
| 44 | 🇹🇹 Trinidad & Tobago | 74 | -3.6% | 0.1% |
| 45 | 🇷🇴 Romania | 65 | -6.2% | 0.1% |
| 46 | 🇩🇰 Denmark | 65 | -1.6% | 0.1% |
| 47 | 🇺🇿 Uzbekistan | 63 | -0.9% | 0.1% |
| 48 | 🇸🇩 Sudan | 62 | -3.3% | 0.1% |
| 49 | 🇹🇳 Tunisia | 40 | -12.9% | 0.0% |
| 50 | Other CIS | 43 | +4.4% | 0.0% |
| 51 | Other Middle East | 210 | +1.2% | 0.2% |
| 52 | Other Africa | 283 | -3.4% | 0.3% |
| 53 | Other Europe | 230 | -20.5% | 0.2% |
| 54 | Other Asia Pacific | 177 | -10.6% | 0.2% |
| 55 | Other S. & Cent. America | 381 | +68.5% | 0.4% |
| Total World | 93,848 | +4.2% | 100.0% |
Behind America’s considerable lead in oil production, Saudi Arabia (ranked 2nd) produced 12 million B/D, accounting for about 13% of global supply.
Russia came in third with 11 million B/D in 2022. Together, these top three oil producing behemoths, along with Canada (4th) and Iraq (5th), make up more than half of the entire world’s oil supply.
Meanwhile, the top 10 oil producers, including those ranked 6th to 10th—China, UAE, Iran, Brazil, and Kuwait—are responsible for more than 70% of the world’s oil production.
Notably, all top 10 oil giants increased their production between 2021–2022, and as a result, global output rose 4.2% year-on-year.
Major Oil Producing Regions in 2022
The Middle East accounts for one-third of global oil production and North America makes up almost another one-third of production. The Commonwealth of Independent States—an organization of post-Soviet Union countries—is another major regional producer of oil, with a 15% share of world production.
| Region | 2022 Production (Thousand B/D) | YoY Change | Share of World Supply |
|---|---|---|---|
| Middle East | 30,743 | +9.2% | 32.8% |
| North America | 25,290 | +5.3% | 27.0% |
| CIS | 14,006 | +0.9% | 14.9% |
| Africa | 7,043 | -3.5% | 7.5% |
| Asia Pacific | 7,273 | -1.4% | 7.8% |
| South & Central America | 6,361 | 7.2% | 6.8% |
| Europe | 3,131 | -8.6% | 3.3% |
What’s starkly apparent in the data however is Europe’s declining share of oil production, now at 3% of the world’s supply. In the last 20 years the EU’s oil output has dropped by more than 50% due to a variety of factors, including stricter environmental regulations and a shift to natural gas.
Another lens to look at regional production is through OPEC members, which control about 35% of the world’s oil output and about 70% of the world’s oil reserves.
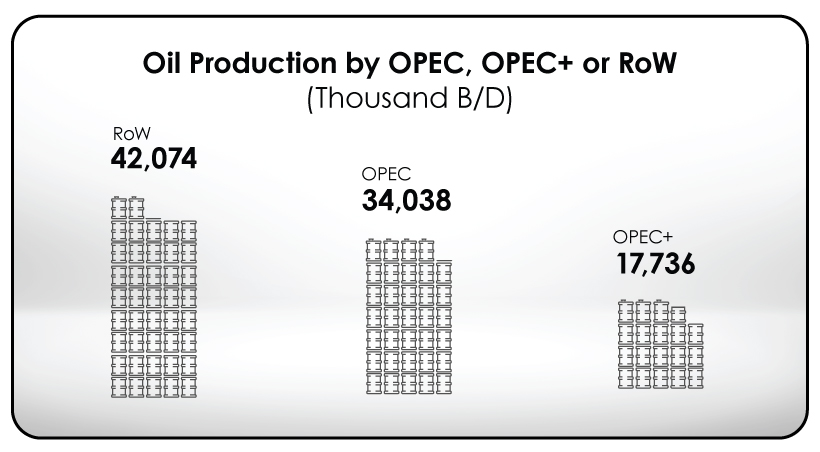
When taking into account the group of 10 oil exporting countries OPEC has relationships with, known as OPEC+, the share of oil production increases to more than half of the world’s supply.
Oil’s Big Balancing Act
Since it’s the very lifeblood of the modern economy, the countries that control significant amounts of oil production also reap immense political and economic benefits. Entire regions have been catapulted into prosperity and wars have been fought over the control of the resource.
At the same time, the ongoing effort to pivot to renewable energy is pushing many major oil exporters to diversify their economies. A notable example is Saudi Arabia, whose sovereign wealth fund has invested in companies like Uber and WeWork.
However, the world still needs oil, as it supplies nearly one-third of global energy demand.


Demographics
Ranked: Countries Where Youth are the Most Unhappy, Relative to Older Generations
Conventional wisdom says that young adults (those below 30) tend to be the happiest demographic—but this is not true for these countries.
Countries with the Biggest Happiness Gaps Between Generations
This was originally posted on our Voronoi app. Download the app for free on iOS or Android and discover incredible data-driven charts from a variety of trusted sources.
“They say a person needs just three things to be truly happy in this world: someone to love, something to do, and something to hope for.” — Tom Bodett
Measuring happiness is tricky business, more so when taking into account how different regions, cultures, and faiths define it. Nevertheless, the World Happiness Report attempts to distill being happy into a single score out of 10, and then ranks countries by their average score.
We’ve visualized the high-level findings from the latest happiness report in this series of maps. However, the report also dives deeper into other significant trends in the data, such as a growing disparity in happiness between age groups within countries themselves.
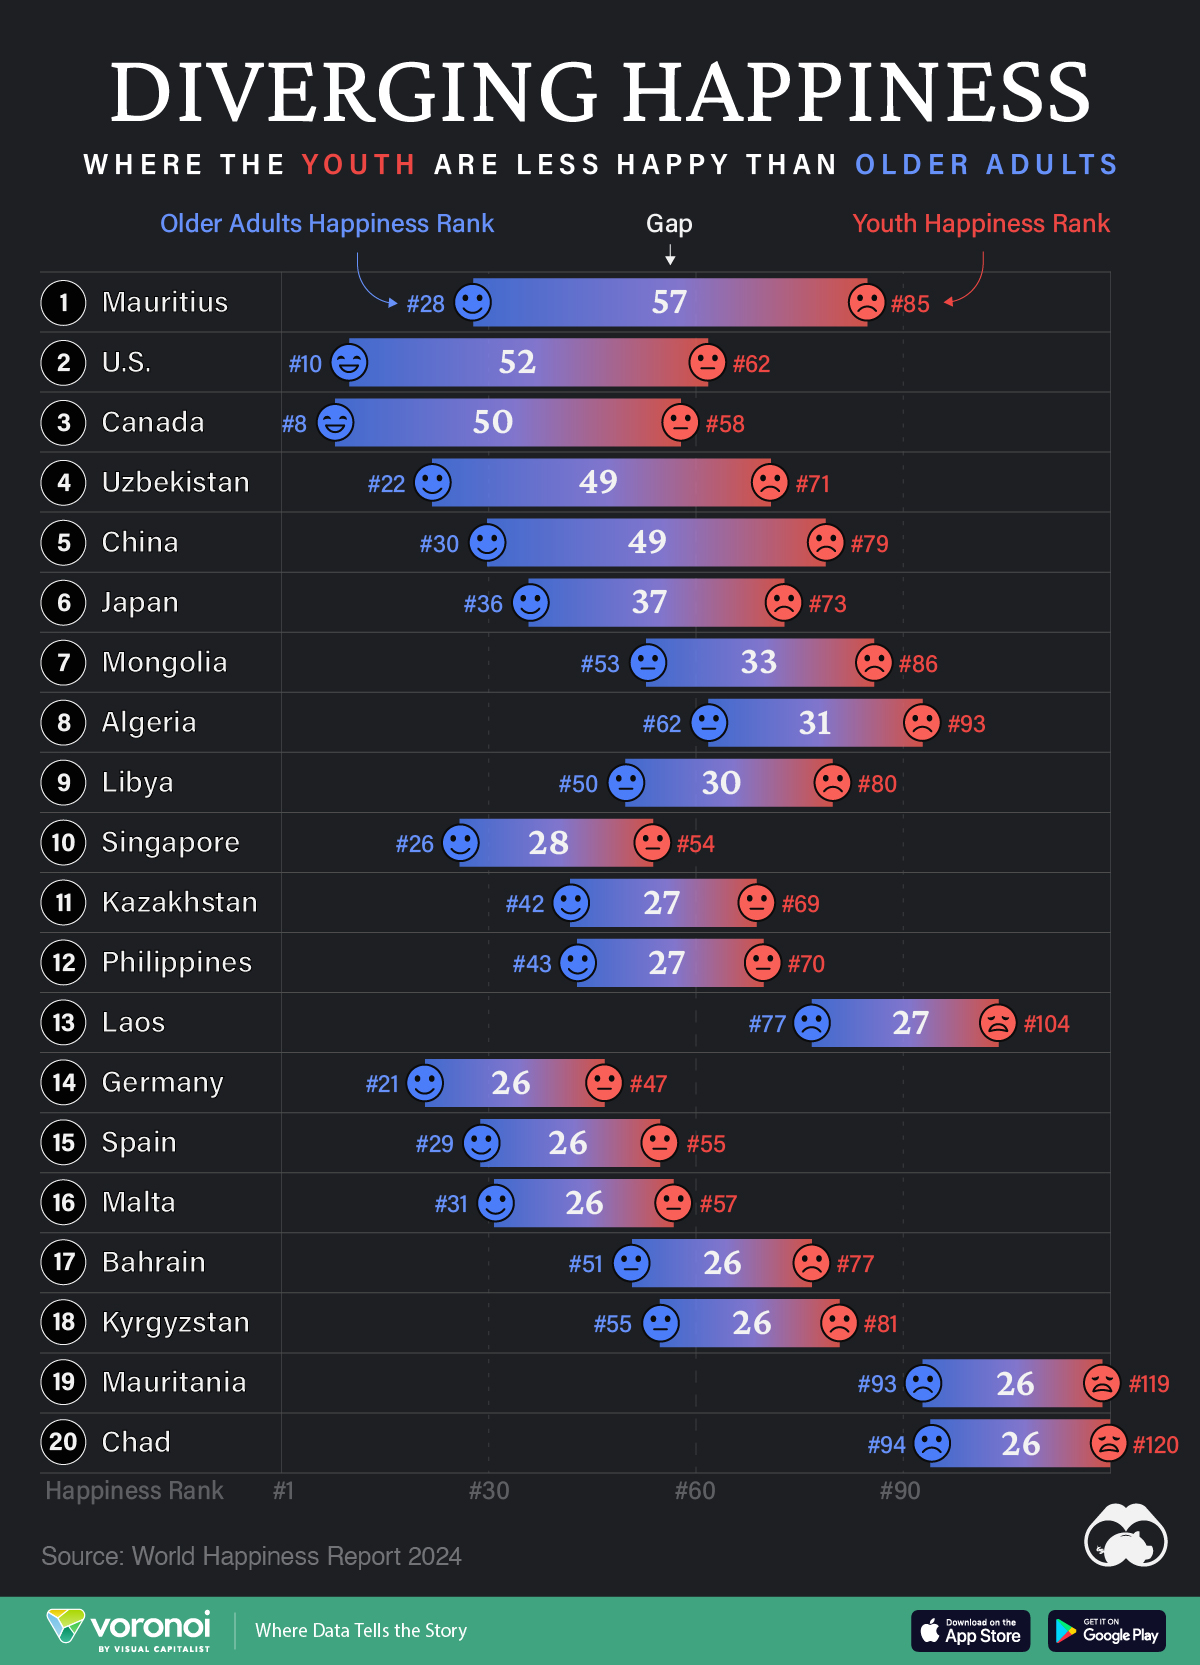
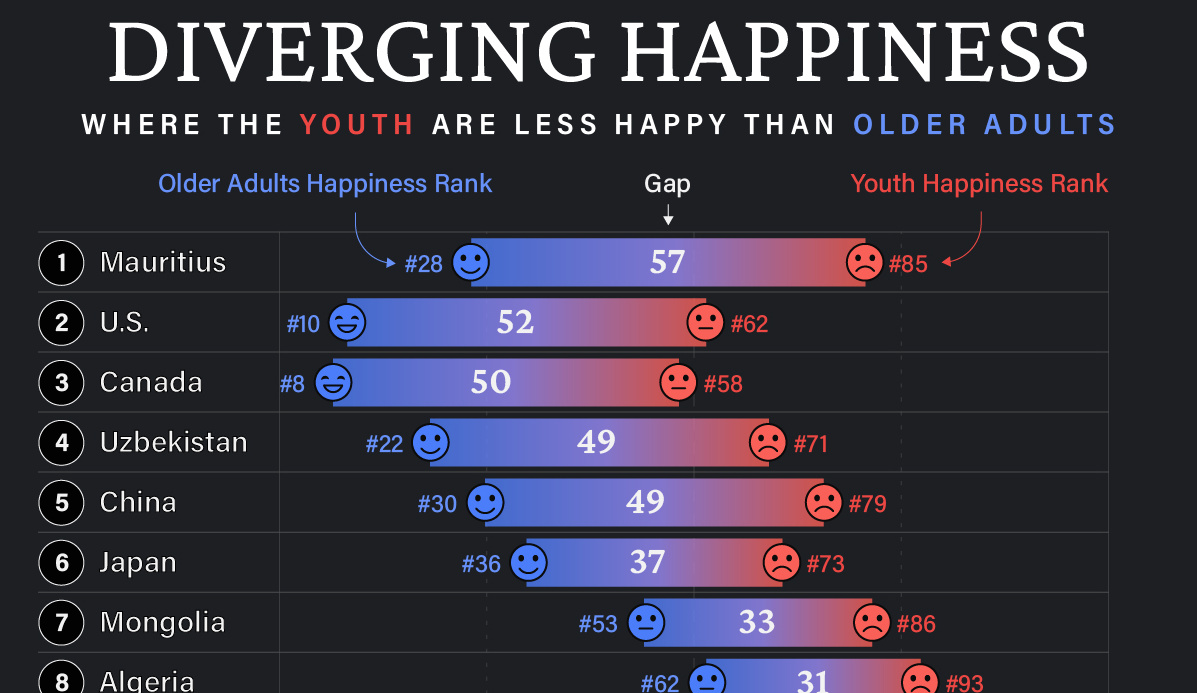
In the chart above, we list countries by the biggest gaps in happiness ranks between young adults (<30) and older adults (60+). A higher number indicates a larger gap, and that the youth are far unhappier than their older counterparts.
Where are Youth Unhappier than Older Adults?
Mauritius ranks first on this list, with a massive 57 place gap between older adult and youth happiness. The 1.26 million-inhabited island nation briefly reached high income status in 2020, but the pandemic hit hard, hurting its key tourism sector, and affecting jobs.
The country’s youth unemployment rate spiked to close to 25% that year, but has since been on the decline. Like residents on many similarly-populated islands, the younger demographic often moves abroad in search of more opportunities.
| Rank | Country | Youth Happiness Rank | Older Adult Happiness Rank | Happiness Gap |
|---|---|---|---|---|
| 1 | 🇲🇺 Mauritius | 85 | 28 | 57 |
| 2 | 🇺🇸 U.S. | 62 | 10 | 52 |
| 3 | 🇨🇦 Canada | 58 | 8 | 50 |
| 4 | 🇺🇿 Uzbekistan | 71 | 22 | 49 |
| 5 | 🇨🇳 China | 79 | 30 | 49 |
| 6 | 🇯🇵 Japan | 73 | 36 | 37 |
| 7 | 🇲🇳 Mongolia | 86 | 53 | 33 |
| 8 | 🇩🇿 Algeria | 93 | 62 | 31 |
| 9 | 🇱🇾 Libya | 80 | 50 | 30 |
| 10 | 🇸🇬 Singapore | 54 | 26 | 28 |
| 11 | 🇰🇿 Kazakhstan | 69 | 42 | 27 |
| 12 | 🇵🇭 Philippines | 70 | 43 | 27 |
| 13 | 🇱🇦 Laos | 104 | 77 | 27 |
| 14 | 🇩🇪 Germany | 47 | 21 | 26 |
| 15 | 🇪🇸 Spain | 55 | 29 | 26 |
| 16 | 🇲🇹 Malta | 57 | 31 | 26 |
| 17 | 🇧🇭 Bahrain | 77 | 51 | 26 |
| 18 | 🇰🇬 Kyrgyzstan | 81 | 55 | 26 |
| 19 | 🇲🇷 Mauritania | 119 | 93 | 26 |
| 20 | 🇹🇩 Chad | 120 | 94 | 26 |
Conventional wisdom says, and data somewhat correlates, that young adults (those below 30) tend to be the happiest demographic. Happiness then decreases through middle age and starts increasing around 60. However, the above countries are digressing from the pattern, with older generations being much happier than young adults.
That older generations are happier, by itself, is not a bad thing. However, that younger adults are so much unhappier in the same country can point to several unique stresses that those aged below 30 are facing.
For example, in the U.S. and Canada—both near the top of this list—many young adults feel like they have been priced out of owning a home: a once key metric of success.
Climate anxieties are also high, with worries about the future of the world they’ll inhabit. Finally, persistent economic inequities are also weighing on the younger generation, with many in that cohort feeling like they will never be able to afford to retire.
All of this comes alongside a rising loneliness epidemic, where those aged 18–25 report much higher rates of loneliness than the general population.
Source: The World Happiness Report which leverages data from the Gallup World Poll.
Methodology: A nationally representative group of approximately 1,000 people per country are asked to evaluate their life on a scale of 0–10. Scores are averaged across generations per country over three years. Countries are ranked by their scores out of 10.

-

 Personal Finance1 week ago
Visualizing the Tax Burden of Every U.S. State
-

 Misc6 days ago
Visualized: Aircraft Carriers by Country
-

 Culture6 days ago
How Popular Snack Brand Logos Have Changed
-

 Mining1 week ago
Visualizing Copper Production by Country in 2023
-

 Misc1 week ago
Charted: How Americans Feel About Federal Government Agencies
-

 Healthcare1 week ago
Which Countries Have the Highest Infant Mortality Rates?
-

 Demographics1 week ago
Mapped: U.S. Immigrants by Region
-

 Maps1 week ago
Mapped: Southeast Asia’s GDP Per Capita, by Country