Energy
Ranked: The Top 10 Countries by Energy Transition Investment
![]() Subscribe to the Elements free mailing list for more like this
Subscribe to the Elements free mailing list for more like this
Ranked: The Top 10 Countries by Energy Transition Investment
This was originally posted on Elements. Sign up to the free mailing list to get beautiful visualizations on natural resource megatrends in your email every week.
More than 130 countries have set or are considering a goal of net-zero emissions by 2050.
Achieving net-zero on a global scale, however, requires $125 trillion in climate investment by 2050, according to research commissioned by the United Nations Framework Convention on Climate Change (UNFCCC).
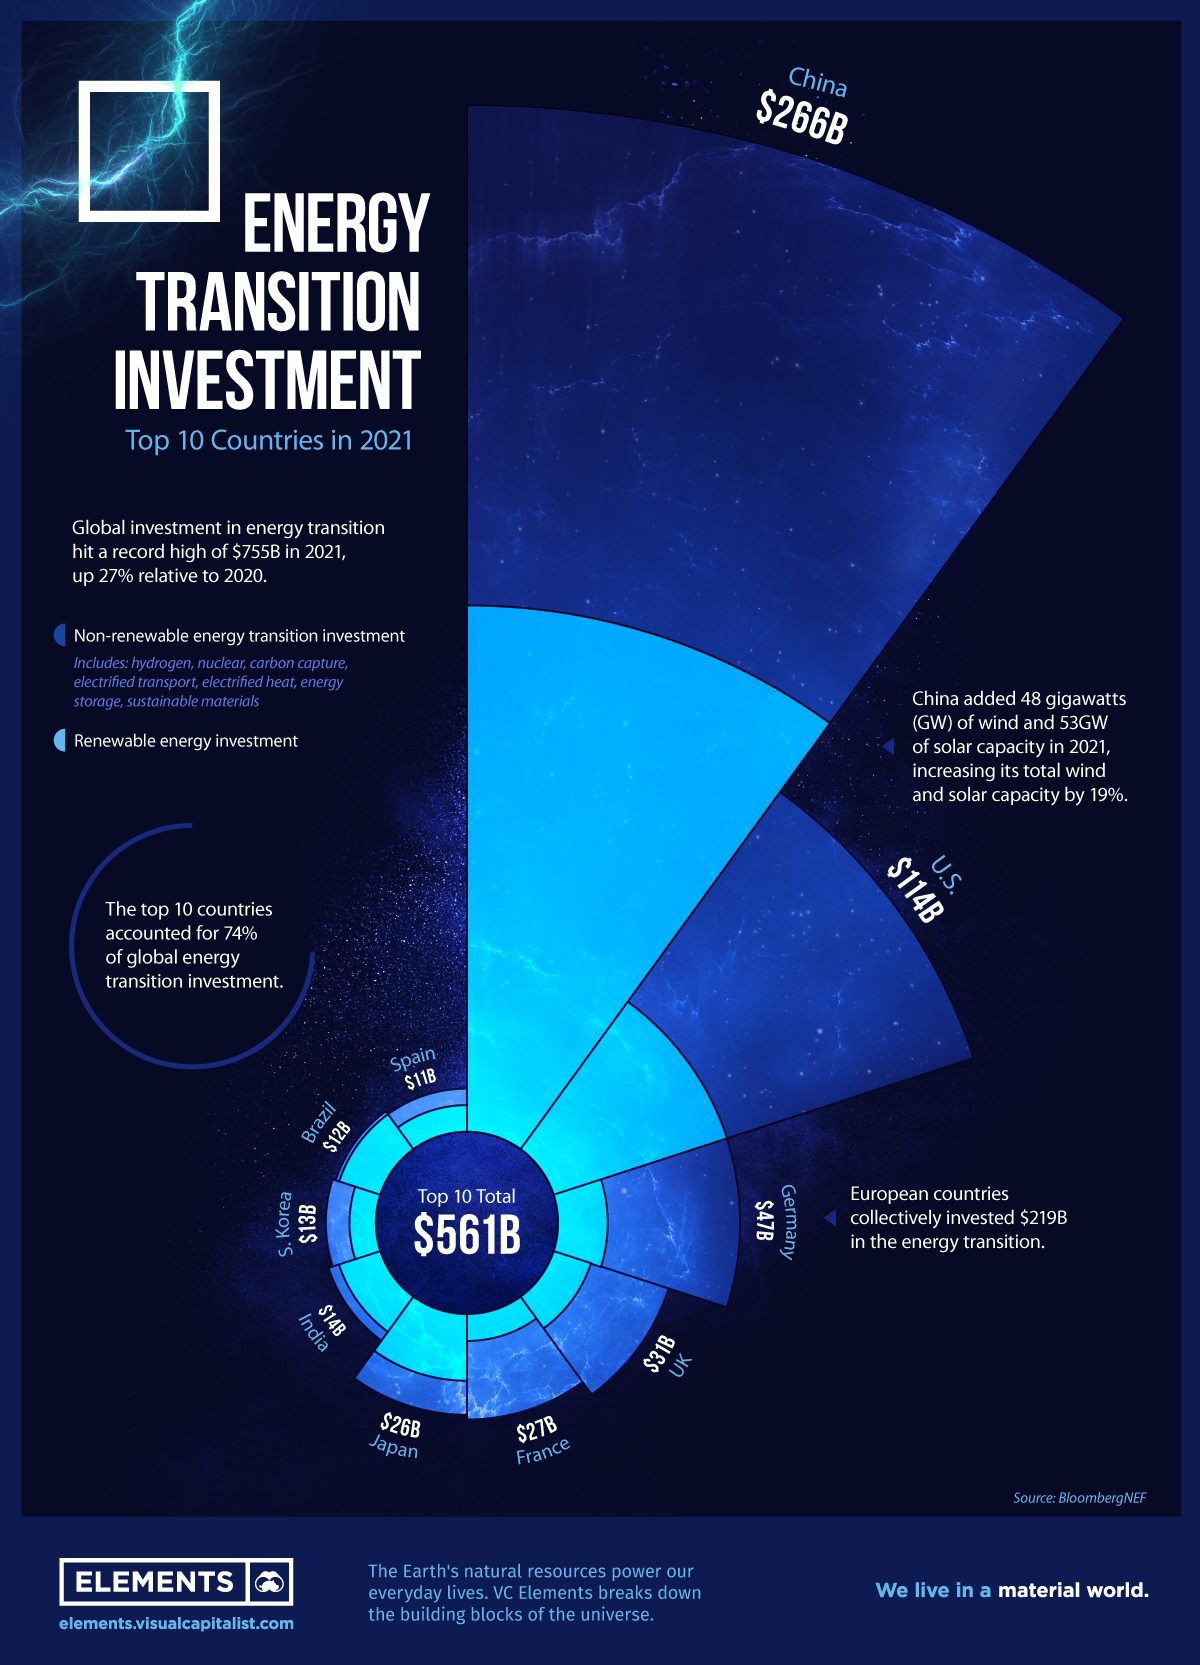
While that level of investment hasn’t been achieved yet, it’s ramping up. In 2021, the world spent $755 billion on deploying low-carbon energy technologies, up 27% from the year prior.
This graphic highlights the top 10 countries by low-carbon energy investment in 2021 using data from BloombergNEF.
Energy Transition Investment by Country
The top 10 countries together invested $561 billion in the energy transition, nearly three-fourths of the world total.
| Country | 2021 Energy Transition Investment (US$) | % of World Total |
|---|---|---|
| China 🇨🇳 | $266B | 35.2% |
| U.S. 🇺🇸 | $114B | 15.1% |
| Germany 🇩🇪 | $47B | 6.2% |
| U.K. 🇬🇧 | $31B | 4.1% |
| France 🇫🇷 | $27B | 3.6% |
| Japan 🇯🇵 | $26B | 3.4% |
| India 🇮🇳 | $14B | 1.9% |
| South Korea 🇰🇷 | $13B | 1.7% |
| Brazil 🇧🇷 | $12B | 1.6% |
| Spain 🇪🇸 | $11B | 1.5% |
| Total | $561B | 74.3% |
China increased its overall energy transition investment by 60% from 2020 levels, further cementing its position as a global leader. The country’s wind and solar capacity increased by 19% in 2021, with electrified transport also accounting for a large portion of the investment.
Next, the U.S. invested $114 billion in clean energy last year, up 17% from 2020. Several European countries also made the top 10 list, with Germany, U.K., and France rounding out the top five. In total, European countries invested $219 billion in the energy transition.
Which Low-Carbon Technologies are Attracting Investment?
While the top 10 countries provide an overview of where investments are being made, it’s also interesting to see which sectors are seeing the biggest influxes of capital.
Here’s a breakdown of energy transition investment by sector in 2021:
| Technology/Sector | Total Investment in 2021 (US$) | % change from 2020 |
|---|---|---|
| Renewable energy | $365.9B | 6.8% |
| Electrified transport | $273.2B | 76.7% |
| Electrified heat | $52.7B | 10.7% |
| Nuclear | $31.5B | 6.1% |
| Sustainable Materials | $19.3B | 141.3% |
| Energy Storage | $7.9B | -6.0% |
| Carbon capture & storage | $2.3B | -23.3% |
| Hydrogen | $2.0B | 33.3% |
| Total | $754.8B | 26.8% |
Renewables accounted for nearly 50% of total investment in 2021. However, electrified transport drove much of the growth as several countries charged ahead in the shift to electric vehicles.
Nuclear power also racked up roughly $32 billion in investments, as conviction grows that it can deliver reliable, carbon-free electricity. But the biggest overall percentage gain was seen in sustainable materials including recycling and bioplastics, which saw investment activity more than double in 2021.
Given that the dawn of clean energy is still in its early hours, technologies in the sector are constantly evolving. As the race to net-zero continues, which energy technologies will draw even more investment in the future?


Who’s Building the Most Solar Energy?
This was originally posted on our Voronoi app. Download the app for free on iOS or Android and discover incredible data-driven charts from a variety of trusted sources.
In 2023, solar energy accounted for three-quarters of renewable capacity additions worldwide. Most of this growth occurred in Asia, the EU, and the U.S., continuing a trend observed over the past decade.
In this graphic, we illustrate the rise in installed solar photovoltaic (PV) capacity in China, the EU, and the U.S. between 2010 and 2022, measured in gigawatts (GW). Bruegel compiled the data..
Chinese Dominance
As of 2022, China’s total installed capacity stands at 393 GW, nearly double that of the EU’s 205 GW and surpassing the USA’s total of 113 GW by more than threefold in absolute terms.
| Installed solar capacity (GW) | China | EU27 | U.S. |
|---|---|---|---|
| 2022 | 393.0 | 205.5 | 113.0 |
| 2021 | 307.0 | 162.7 | 95.4 |
| 2020 | 254.0 | 136.9 | 76.4 |
| 2019 | 205.0 | 120.1 | 61.6 |
| 2018 | 175.3 | 104.0 | 52.0 |
| 2017 | 130.8 | 96.2 | 43.8 |
| 2016 | 77.8 | 91.5 | 35.4 |
| 2015 | 43.6 | 87.7 | 24.2 |
| 2014 | 28.4 | 83.6 | 18.1 |
| 2013 | 17.8 | 79.7 | 13.3 |
| 2012 | 6.7 | 71.1 | 8.6 |
| 2011 | 3.1 | 53.3 | 5.6 |
| 2010 | 1.0 | 30.6 | 3.4 |
Since 2017, China has shown a compound annual growth rate (CAGR) of approximately 25% in installed PV capacity, while the USA has seen a CAGR of 21%, and the EU of 16%.
Additionally, China dominates the production of solar power components, currently controlling around 80% of the world’s solar panel supply chain.
In 2022, China’s solar industry employed 2.76 million individuals, with manufacturing roles representing approximately 1.8 million and the remaining 918,000 jobs in construction, installation, and operations and maintenance.
The EU industry employed 648,000 individuals, while the U.S. reached 264,000 jobs.
According to the IEA, China accounts for almost 60% of new renewable capacity expected to become operational globally by 2028.
Despite the phasing out of national subsidies in 2020 and 2021, deployment of solar PV in China is accelerating. The country is expected to reach its national 2030 target for wind and solar PV installations in 2024, six years ahead of schedule.

-

 Markets6 days ago
Mapped: Europe’s GDP Per Capita, by Country
-

 Energy2 weeks ago
Mapped: The Age of Energy Projects in Interconnection Queues, by State
-

 Mining2 weeks ago
Visualizing Global Gold Production in 2023
-

 Markets2 weeks ago
Visualized: Interest Rate Forecasts for Advanced Economies
-

 Markets2 weeks ago
The Most Valuable Companies in Major EU Economies
-

 Markets1 week ago
The World’s Fastest Growing Emerging Markets (2024-2029 Forecast)
-

 Markets1 week ago
Visualizing Global Inflation Forecasts (2024-2026)
-

 Politics1 week ago
Charted: What Southeast Asia Thinks About China & the U.S.