Misc
Ranked: The World’s Most Valuable Football Club Brands
Ranked: The World’s Most Valuable Football Club Brands
When the oldest national football competition—the FA Cup—was first played in 1872, the players didn’t get paid, clubs were local associations, and there were no such things as football brands.
Skip ahead a century and a half and many football clubs have comparable levels of global recognition to well-known consumer brands like Apple or Coca-Cola, while simultaneously commanding immense loyalty from fans from all walks of life.
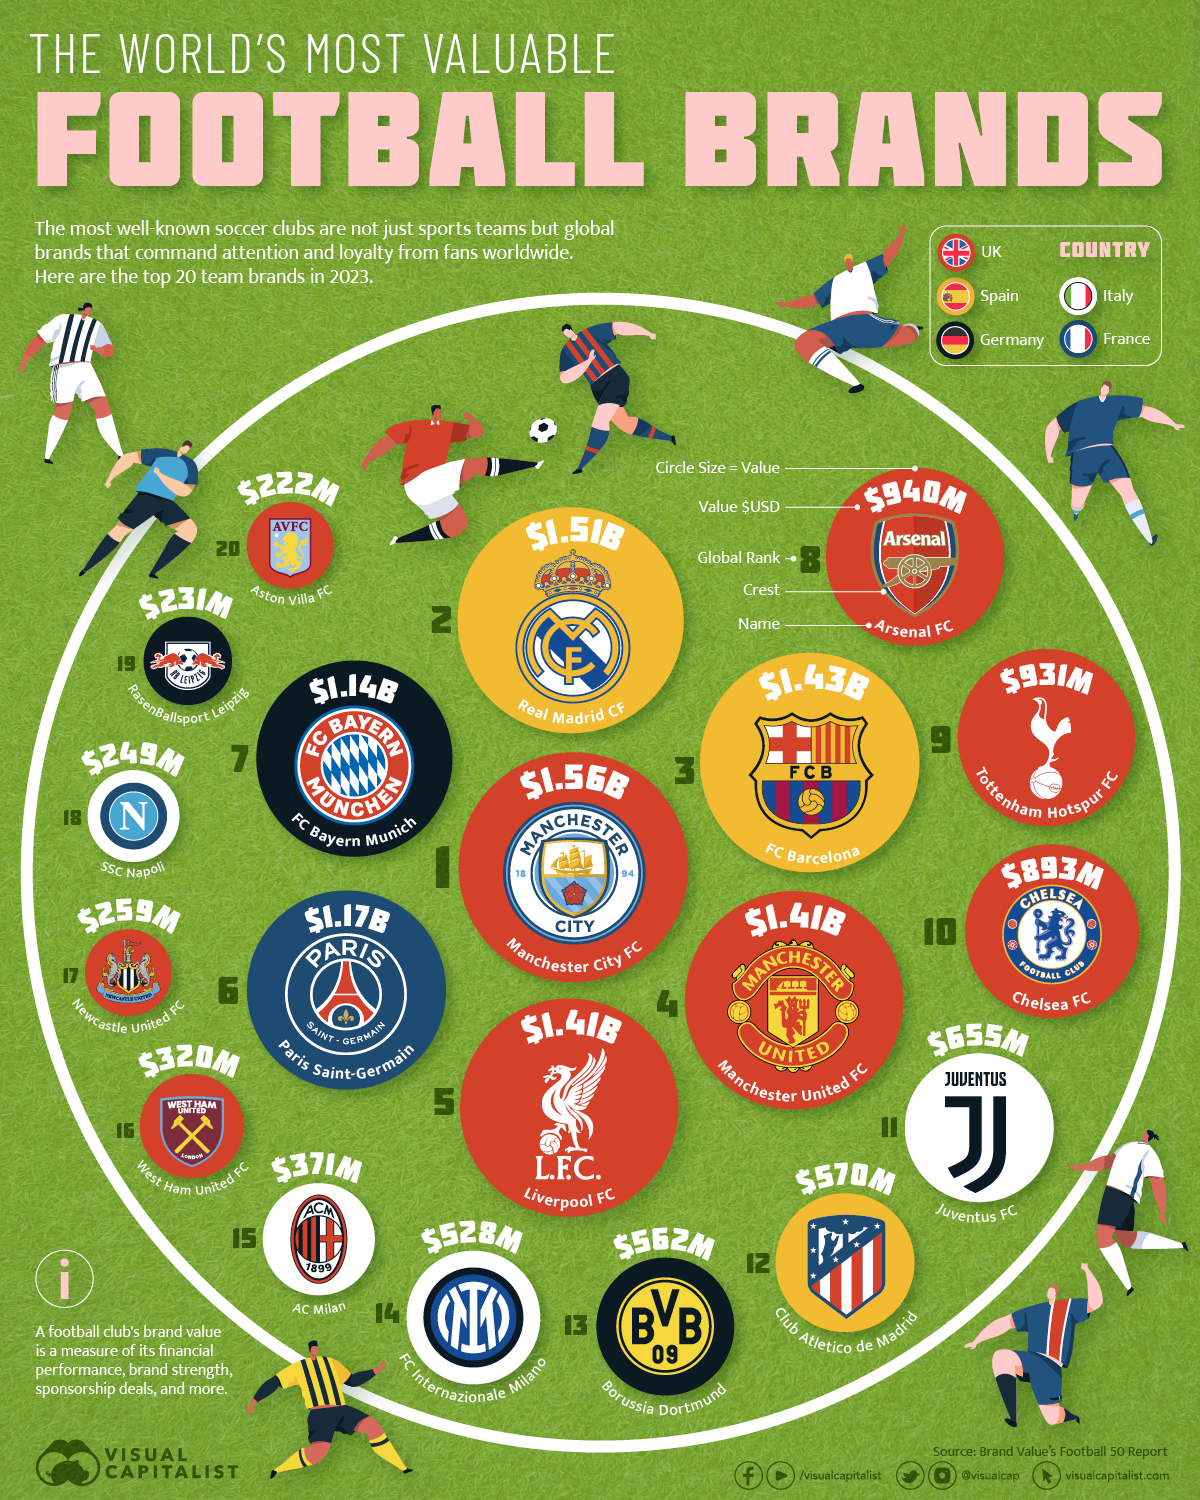
These characteristics have immense financial worth. Today we find out which clubs, aside from competing on the pitch, also compete as football brands. Brand Finance, a brand valuation and strategy consultancy, has compiled a list of the world’s 50 most valuable football club brands.
Which Football Club Has the Most Valuable Brand?
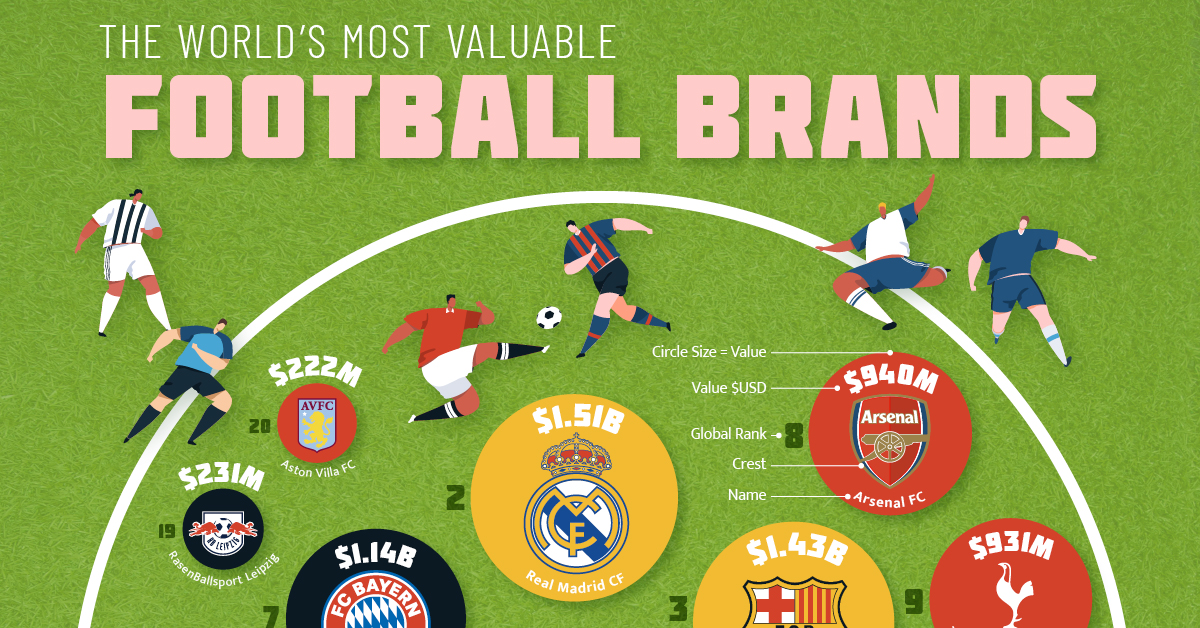
Prized at $1.56 billion in 2023, Manchester City FC of England’s Premier League takes the top spot as the most valuable football brand.
The club’s brand value grew 13.5% in the last year, a testament to the club’s recent and sustained success on the domestic and international fronts. It has won the Premier league seven times since 2011, and in 2023 the club completed a historic “treble”—winning the Premier League, Champions League, and FA Cup, all in one season.
Here’s a look at the world’s top 50 most valued football club brands, listed in USD millions.
| Rank | Brand | Country | Brand Value (USD millions) | Value Change (2022-2023) |
|---|---|---|---|---|
| 1 | Manchester City FC | 🇬🇧 UK | $1,562 | +13.50% |
| 2 | Real Madrid CF | 🇪🇸 Spain | $1,513 | -14.40% |
| 3 | FC Barcelona | 🇪🇸 Spain | $1,425 | -7.20% |
| 4 | Manchester United FC | 🇬🇧 UK | $1,412 | -2.60% |
| 5 | Liverpool FC | 🇬🇧 UK | $1,411 | -4.40% |
| 6 | Paris Saint-Germain | 🇫🇷 France | $1,174 | -1.40% |
| 7 | FC Bayern Munich | 🇩🇪 Germany | $1,140 | -11.30% |
| 8 | Arsenal FC | 🇬🇧 UK | $940 | +0.02% |
| 9 | Tottenham Hotspur FC | 🇬🇧 UK | $931 | -8.00% |
| 10 | Chelsea FC | 🇬🇧 UK | $893 | -9.90% |
| 11 | Juventus FC | 🇮🇹 Italy | $655 | -19.90% |
| 12 | Club Atletico de Madrid | 🇪🇸 Spain | $570 | -15.10% |
| 13 | Borussia Dortmund | 🇩🇪 Germany | $562 | -6.30% |
| 14 | FC Internazionale Milano | 🇮🇹 Italy | $528 | -8.00% |
| 15 | AC Milan | 🇮🇹 Italy | $371 | +0.19% |
| 16 | West Ham United FC | 🇬🇧 UK | $320 | -6.40% |
| 17 | Newcastle United FC | 🇬🇧 UK | $259 | +0.17% |
| 18 | SSC Napoli | 🇮🇹 Italy | $249 | +0.18% |
| 19 | RasenBallsport Leipzig | 🇩🇪 Germany | $231 | -18.40% |
| 20 | Aston Villa FC | 🇬🇧 UK | $222 | +0.04% |
| 21 | AS Roma | 🇮🇹 Italy | $212 | +0.01% |
| 22 | Eintracht Frankfurt | 🇩🇪 Germany | $210 | -5.40% |
| 23 | Everton FC | 🇬🇧 UK | $205 | -13.60% |
| 24 | Bayer 04 Leverkusen | 🇩🇪 Germany | $202 | -8.00% |
| 25 | Sevilla FC | 🇪🇸 Spain | $196 | -5.10% |
| 26 | Brighton & Hove Albion FC | 🇬🇧 UK | $189 | -3.00% |
| 27 | Leicester City | 🇬🇧 UK | $187 | -40.70% |
| 28 | Olympique De Marseille | 🇫🇷 France | $179 | +0.07% |
| 29 | Crystal Palace | 🇬🇧 UK | $174 | -1.70% |
| 30 | AFC Ajax | 🇳🇱 Netherlands | $172 | -18.90% |
| 31 | Olympique Lyonnais | 🇫🇷 France | $166 | -6.90% |
| 32 | Wolverhampton Wanderers FC | 🇬🇧 UK | $166 | -29.80% |
| 33 | Leeds United | 🇬🇧 UK | $160 | -25.60% |
| 34 | Real Betis | 🇪🇸 Spain | $159 | +0.17% |
| 35 | Borussia Monchengladbach | 🇩🇪 Germany | $157 | -18.80% |
| 36 | Villarreal CF | 🇪🇸 Spain | $143 | -6.30% |
| 37 | Real Sociedad | 🇪🇸 Spain | $139 | N/A |
| 38 | VfL Wolfsburg | 🇩🇪 Germany | $128 | -34.90% |
| 39 | 1.FC Koln | 🇩🇪 Germany | $125 | -3.30% |
| 40 | SC Freiburg | 🇩🇪 Germany | $125 | N/A |
| 41 | SL Benfica | 🇵🇹 Portugal | $123 | +0.05% |
| 42 | Celtic FC | 🇬🇧 UK | $118 | -9.70% |
| 43 | Brentford FC | 🇬🇧 UK | $118 | N/A |
| 44 | Athletic de Bilbao | 🇪🇸 Spain | $117 | -23.50% |
| 45 | SS Lazio SpA | 🇮🇹 Italy | $116 | N/A |
| 46 | 1.FC Union Berlin | 🇩🇪 Germany | $112 | N/A |
| 47 | Valencia CF | 🇪🇸 Spain | $112 | -38.70% |
| 48 | FC Porto | 🇵🇹 Portugal | $105 | N/A |
| 49 | Fulham FC | 🇬🇧 UK | $104 | N/A |
| 50 | CR Flamengo | 🇧🇷 Brazil | $102 | -8.80% |
Close on City’s heels, Spain’s Real Madrid CF brand is also valued slightly above $1.5 billion, but is down 14% in the last year. The club lost their hold on both their domestic league and European championship titles this season, contributing to their decrease in brand worth in 2023.
On the Catalonian side of Spain, FC Barcelona’s brand remains ranked in third place, valued at $1.4 billion. The two Spanish giants have a near duopoly over La Liga, Spain’s domestic league, with one of them having won the title 62 times in the 94 years since the league was founded.
The rivalry gained another edge in the 2000s, hosting one each of Lionel Messi and Cristiano Ronaldo—two of the most-followed celebrities in the world and often regarded as some of the greatest players to play the game.
And while both Messi and Ronaldo left in the last five years, Barcelona and Real Madrid’s brands have stayed resilient. Both clubs have consistently ranked in the top five most valuable football club brands since 2013.
Four more club brands have been valued above $1 billion:
- Manchester United FC, England, ($1.41 billion)
- Liverpool FC, England ($1.41 billion)
- Paris Saint-Germain, France ($1.17 billion)
- FC Bayern Munich, Germany ($1.14 billion)
Countries with the Most Valuable Football Brands
From a regional perspective, the UK is home to the most high-worth football club brands (18), all of them in England with the sole exception of Scotland’s Celtic FC.
| Country | Clubs | Brand Value (USD millions) |
|---|---|---|
| 🇬🇧 UK | 18 | $9,371 |
| 🇩🇪 Germany | 10 | $2,992 |
| 🇪🇸 Spain | 9 | $4,374 |
| 🇮🇹 Italy | 6 | $2,131 |
| 🇫🇷 France | 3 | $1,519 |
| 🇵🇹 Portugal | 2 | $228 |
| 🇳🇱 Netherlands | 1 | $172 |
| 🇧🇷 Brazil | 1 | $102 |
| Total | 50 | $20,889 |
The UK is followed by Germany (10) and Spain (9) with the most high-valued brands. Together, the top three countries account for almost three quarters of the most valued football club brands in the world.
With an even broader-picture gaze, Europe is home to 49 of the 50 listed clubs, a testament to the strength of the European football market. The only non-European team to make the list was CR Flamengo from Brazil.
What’s in a Brand?
While the value of a football club brand is not the same as the club value itself, a strong brand can do wonders for a club’s financial performance, and eventual value.
Just look at Manchester United, which hasn’t quite regained its stellar performances on field since Sir Alex Ferguson left in 2013, but nevertheless continues to be a commercial juggernaut—it had the fourth highest jersey sales in 2021.
A similar story can be seen with Saudi Arabian club Al-Nassr when it signed Cristiano Ronaldo, which drove visits to its merchandise store up 300%.
With the new football season around the corner, it will be fascinating to see how the rankings of most valuable football brands change next year.
Where Does This Data Come From?
Source: Brand Finance’s 2023 Football 50 Report.
Data note: Some clubs were not ranked in the top 50 in 2022, leading to missing data for brand value and rank changes in the last year. These entires have been marked with an “N/A” where required.


Misc
The Top 25 Nationalities of U.S. Immigrants
Mexico is the largest source of immigrants to the U.S., with almost 11 million immigrants.


The Top 25 Nationalities of U.S. Immigrants
This was originally posted on our Voronoi app. Download the app for free on iOS or Android and discover incredible data-driven charts from a variety of trusted sources.
The United States is home to more than 46 million immigrants, constituting approximately 14% of its total population.
This graphic displays the top 25 countries of origin for U.S. immigrants, based on 2022 estimates. The data is sourced from the Migration Policy Institute (MPI), which analyzed information from the U.S. Census Bureau’s 2022 American Community Survey.
In this context, “immigrants” refer to individuals residing in the United States who were not U.S. citizens at birth.
Mexico Emerges as a Leading Source of Immigration
Mexico stands out as the largest contributor to U.S. immigration due to its geographical proximity and historical ties.
Various economic factors, including wage disparities and employment opportunities, motivate many Mexicans to seek better prospects north of the border.
| Country | Region | # of Immigrants |
|---|---|---|
| 🇲🇽 Mexico | Latin America & Caribbean | 10,678,502 |
| 🇮🇳 India | Asia | 2,839,618 |
| 🇨🇳 China | Asia | 2,217,894 |
| 🇵🇭 Philippines | Asia | 1,982,333 |
| 🇸🇻 El Salvador | Latin America & Caribbean | 1,407,622 |
| 🇻🇳 Vietnam | Asia | 1,331,192 |
| 🇨🇺 Cuba | Latin America & Caribbean | 1,312,510 |
| 🇩🇴 Dominican Republic | Latin America & Caribbean | 1,279,900 |
| 🇬🇹 Guatemala | Latin America & Caribbean | 1,148,543 |
| 🇰🇷 Korea | Asia | 1,045,100 |
| 🇨🇴 Colombia | Latin America & Caribbean | 928,053 |
| 🇭🇳 Honduras | Latin America & Caribbean | 843,774 |
| 🇨🇦 Canada | Northern America | 821,322 |
| 🇯🇲 Jamaica | Latin America & Caribbean | 804,775 |
| 🇭🇹 Haiti | Latin America & Caribbean | 730,780 |
| 🇬🇧 United Kingdom | Europe | 676,652 |
| 🇻🇪 Venezuela | Latin America & Caribbean | 667,664 |
| 🇧🇷 Brazil | Latin America & Caribbean | 618,525 |
| 🇩🇪 Germany | Europe | 537,484 |
| 🇪🇨 Ecuador | Latin America & Caribbean | 518,287 |
| 🇵🇪 Peru | Latin America & Caribbean | 471,988 |
| 🇳🇬 Nigeria | Africa | 448,405 |
| 🇺🇦 Ukraine | Europe | 427,163 |
| 🇮🇷 Iran | Middle East | 407,283 |
| 🇵🇰 Pakistan | Asia | 399,086 |
| Rest of World | 11,637,634 | |
| Total | 46,182,089 |
Mexicans are followed in this ranking by Indians, Chinese, and Filipinos, though most immigrants on this list come from countries in the Latin American and Caribbean region.
On the other hand, only three European countries are among the top sources of U.S. immigrants: the UK, Germany, and Ukraine.
Immigration continues to be a significant factor contributing to the overall growth of the U.S. population. Overall population growth has decelerated over the past decade primarily due to declining birth rates.
Between 2021 and 2022, the increase in the immigrant population accounted for 65% of the total population growth in the U.S., representing 912,000 individuals out of nearly 1.4 million.
If you enjoyed this post, be sure to check out Visualized: Why Do People Immigrate to the U.S.? This visualization shows the different reasons cited by new arrivals to America in 2021.

-

 Mining1 week ago
Where the World’s Aluminum is Smelted, by Country
-

 Culture6 days ago
How Popular Snack Brand Logos Have Changed
-

 Mining7 days ago
Visualizing Copper Production by Country in 2023
-

 Politics1 week ago
Charted: How Americans Feel About Federal Government Agencies
-

 Healthcare1 week ago
Which Countries Have the Highest Infant Mortality Rates?
-

 Demographics1 week ago
Mapped: U.S. Immigrants by Region
-

 Economy1 week ago
Mapped: Southeast Asia’s GDP Per Capita, by Country
-

 Automotive1 week ago
How People Get Around in America, Europe, and Asia