Mining
Visualizing China’s Dominance in Rare Earth Metals
![]()
China’s Dominance in Rare Earth Metals
Did you know that a single iPhone contains eight different rare earth metals?
From smartphones and electric vehicles to x-rays and guided-missiles, several modern technologies wouldn’t be what they are without rare earth metals. Also known as rare earth elements or simply “rare earths”, this group of 17 elements is critical to a number of wide-ranging industries.
Although deposits of rare earth metals exist all over the world, the majority of both mining and refining occurs in China. The above graphic from CSIS China Power Project tracks China’s exports of rare earth metals in 2019, providing a glimpse of the country’s dominating presence in the global supply chain.
China’s Top Rare Earth Export Destinations
Around 88% of China’s 2019 rare earth exports went to just five countries, which are among the world’s technological and economic powerhouses.
| Export Destination | Share of China's Rare Earth Exports | Top Rare Earth Import (tons) |
|---|---|---|
| Japan | 36.0% | Cerium |
| United States | 33.4% | Lanthanum |
| Netherlands | 9.6% | Lanthanum |
| South Korea | 5.4% | Lanthanum |
| Italy | 3.5% | Cerium |
| Rest of the World | 12.1% | Cerium |
Japan and the U.S. are by far the largest importers, collectively accounting for more than two-thirds of China’s rare earth metals exports.
Lanthanum, found in hybrid vehicles and smartphones, was China’s largest rare earth export by volume, followed by cerium. In dollar terms, terbium was the most expensive—generating $57.9 million from just 115 metric tons of exports.
Why China’s Dominance Matters
As the world transitions to a cleaner future, the demand for rare earth metals is expected to nearly double by 2030, and countries are in need of a reliable supply chain.
China’s virtual monopoly in rare earth metals not only gives it a strategic upper hand over heavily dependent countries like the U.S.—which imports 80% of its rare earths from China—but also makes the supply chain anything but reliable.
“China will not rule out using rare earth exports as leverage to deal with the [Trade War] situation.”
—Gao Fengping et al., 2019, in a report funded by the Chinese government via Horizon Advisory.
A case in point comes from 2010 when China reduced its rare earth export quotas by 37%, which in part resulted in skyrocketing rare earth prices worldwide.
![]()
The resulting supply chain disruption was significant enough to push the EU, the U.S., and Japan to jointly launch a dispute settlement case through the World Trade Organization, which was ruled against China in 2014.
On the brighter side, the increase in prices led to an influx of capital in the rare earth mining industry, financing more than 200 projects outside China. While this exploration boom was short-lived, it was successful in kick-starting production in other parts of the world.
Breaking China’s Rare Earth Monopoly
China’s dominance in rare earths is the result of years of evolving industrial policies since the 1980s, ranging from tax rebates to export restrictions. In order to reduce dependence on China, the U.S. and Japan have made it a priority to diversify their sources of rare earth metals.
For starters, the U.S. has added rare earth metals to its list of critical minerals, and President Donald Trump recently issued an executive order to encourage local production. On the other side of the world, Japan is making efforts to reduce China’s share of its total rare earth imports to less than 50% by 2025.
Increasing rare earth mining outside of China has reduced China’s global share of mining, down from 97.7% in 2010 to 62.9% in 2019. But mining is merely one piece of the puzzle.
Ultimately, the large majority of rare earth refining, 80%, resides in China. Therefore, even rare earths mined overseas are sent to China for final processing. New North American refining facilities are being set up to tackle this, but the challenge lies in managing the environmental impacts of processing rare earths.


Mining
The Biggest Salt Producing Countries in 2023
In this graphic, we break down global salt production in 2023. China is currently the top producer, accounting for almost 20% of output.
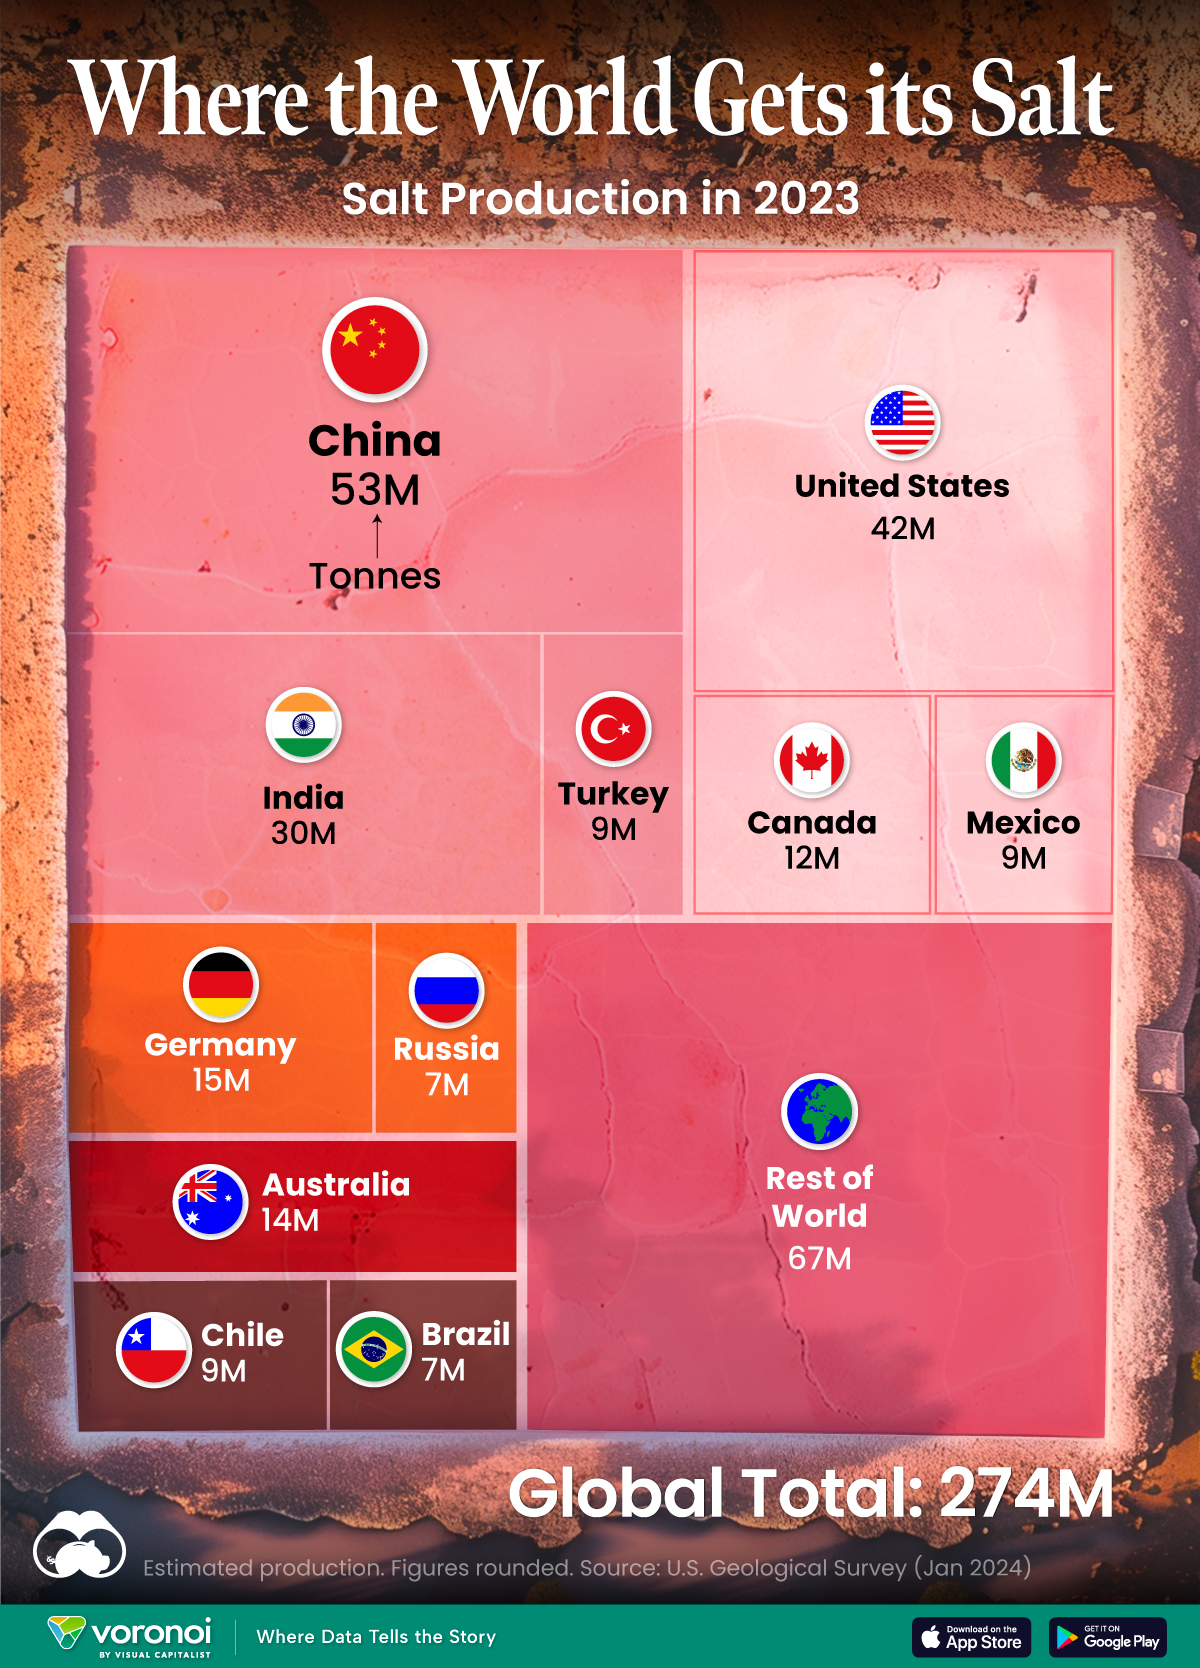
The Biggest Salt Producing Countries in 2023
This was originally posted on our Voronoi app. Download the app for free on iOS or Android and discover incredible data-driven charts from a variety of trusted sources.
Humanity has utilized salt for thousands of years, dating back to ancient civilizations. The U.S. alone consumes more than 48 million tonnes of salt per year.
In this graphic, we break down global salt production in 2023, measured in tonnes. These estimates come from the U.S. Geological Survey’s latest commodity report on salt.
Ample Supply
Salt is essential for human life, serving various purposes including food preservation, flavor enhancement, industrial processes, and health maintenance. The good news is that the world’s continental resources of salt are vast, and the salt content in the oceans is nearly unlimited.
China is currently the top producer of salt, with almost 20% of the output, followed by the U.S. (15%) and India (11%).
| Country | Production (tonnes) |
|---|---|
| 🇨🇳 China | 53,000,000 |
| 🇺🇸 United States | 42,000,000 |
| 🇮🇳 India | 30,000,000 |
| 🇩🇪 Germany | 15,000,000 |
| 🇦🇺 Australia | 14,000,000 |
| 🇨🇦 Canada | 12,000,000 |
| 🇨🇱 Chile | 9,200,000 |
| 🇲🇽 Mexico | 9,000,000 |
| 🇹🇷 Turkey | 9,000,000 |
| 🇷🇺 Russia | 7,000,000 |
| 🇧🇷 Brazil | 6,600,000 |
| Rest of world | 67,000,000 |
| Global total | 273,800,000 |
The global salt market was valued at $32.6 billion in 2022.
It’s projected to grow from $34.1 billion in 2023 to $48.6 billion by 2030, with a CAGR of 5.2% during the forecast period. This suggests a surprising amount of growth for what is one of the world’s oldest and most common commodities.
Facts About the U.S. Salt Industry
In the U.S., salt is produced by 25 companies, which operate 63 plants across 16 states.
The states that produce the most salt are Kansas, Louisiana, Michigan, New York, Ohio, Texas, and Utah. Altogether, these states account for 95% of domestic production.
The primary uses of salt in the U.S. are highway de-icing (41%), chemical production (38%), and food processing (10%).

-

 Mining6 days ago
Where the World’s Aluminum is Smelted, by Country
-

 Markets2 weeks ago
Visualized: Interest Rate Forecasts for Advanced Economies
-

 Economy2 weeks ago
The Most Valuable Companies in Major EU Economies
-

 Markets2 weeks ago
The World’s Fastest Growing Emerging Markets (2024-2029 Forecast)
-

 Markets2 weeks ago
Visualizing Global Inflation Forecasts (2024-2026)
-

 Politics1 week ago
Charted: What Southeast Asia Thinks About China & the U.S.
-

 Misc1 week ago
The Evolution of U.S. Beer Logos
-

 Healthcare1 week ago
What Causes Preventable Child Deaths?