Economy
All the World’s Metals and Minerals in One Visualization

 Can I share this graphic?
 When do I need a license?
 Interested in this piece?
All the World’s Metals and Minerals in One Visualization
We live in a material world, in that we rely on materials to make our lives better. Without even realizing it, humans consume enormous amounts of metals and minerals with every convenient food package, impressive building, and technological innovation.
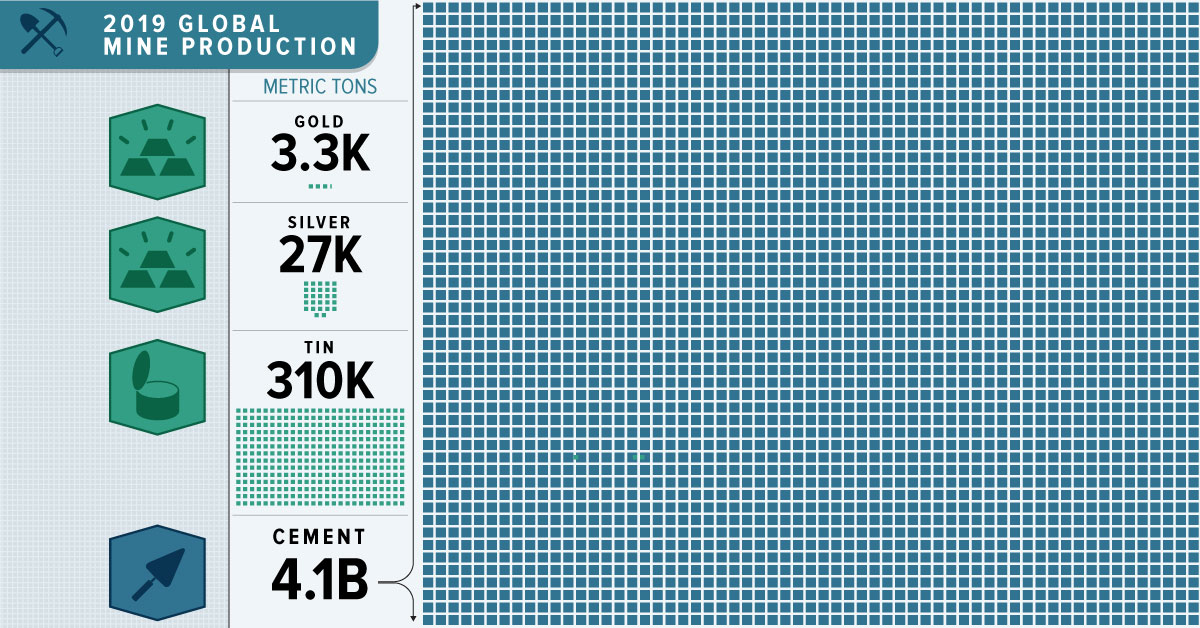
Every year, the United States Geological Service (USGS) publishes commodity summaries outlining global mining statistics for over 90 individual minerals and materials. Today’s infographic visualizes the data to reveal the dramatic scale of 2019 non-fuel mineral production.
Read all the way to the bottom; the data will surprise you.
Non-Fuel Minerals: USGS Methodology
A wide variety of minerals can be classified as “non-fuel”, including precious metals, base metals, industrial minerals, and materials used for construction.
Non-fuel minerals are those not used for fuel, such as oil, natural gas and coal. Once non-fuel minerals are used up, there is no replacing them. However, many can be recycled continuously.
The USGS tracked both refinery and mine production of these various minerals. This means that some minerals are the essential ingredients for others on the list. For example, iron ore is critical for steel production, and bauxite ore gets refined into aluminum.
Top 10 Minerals and Metals by Production
Sand and gravel are at the top of the list of non-fuel mineral production.
As these materials are the basic components for the manufacturing of concrete, roads, and buildings, it’s not surprising they take the lead.
| Rank | Metal/Mineral | 2019 Production (millions of metric tons) |
|---|---|---|
| #1 | Sand and Gravel | 50,000 |
| #2 | Cement | 4,100 |
| #3 | Iron and Steel | 3,200 |
| #4 | Iron Ore | 2,500 |
| #5 | Bauxite | 500 |
| #6 | Lime | 430 |
| #7 | Salt | 293 |
| #8 | Phosphate Rock | 240 |
| #9 | Nitrogen | 150 |
| #10 | Gypsum | 140 |
These materials fertilize the food we eat, and they also form the structures we live in and the roads we drive on. They are the bones of the global economy.
Let’s dive into some more specific categories covered on the infographic.
Base Metals
While cement, sand, and gravel may be the bones of global infrastructure, base metals are its lifeblood. Their consumption is an important indicator of the overall health of an economy.
Base metals are non-ferrous, meaning they contain no iron. They are often more abundant in nature and sometimes easier to mine, so their prices are generally lower than precious metals.
| Rank | Base Metal | 2019 Production (millions of metric tons) |
|---|---|---|
| #1 | Aluminum | 64.0 |
| #2 | Copper | 20.0 |
| #3 | Zinc | 13.0 |
| #4 | Lead | 4.5 |
| #5 | Nickel | 2.7 |
| #6 | Tin | 0.3 |
Base metals are also the critical materials that will help to deliver a green and renewable future. The electrification of everything will require vast amounts of base metals to make everything from batteries to solar cells work.
Precious Metals
Gold and precious metals grab the headlines because of their rarity — and their production shows just how rare they are.
| Rank | Precious Metal | 2019 Production (metric tons) |
|---|---|---|
| #1 | Silver | 27,000 |
| #2 | Gold | 3,300 |
| #3 | Palladium | 210 |
| #4 | Platinum | 180 |
While metals form the structure and veins of the global economy, ultimately it is humans and animals that make the flesh of the world, driving consumption patterns.
A Material World: A Perspective on Scale
The global economy’s appetite for materials has quadrupled since 1970, faster than the population, which only doubled. On average, each human uses more than 13 metric tons of materials per year.
In 2017, it’s estimated that humans consumed 100.6B metric tons of material in total. Half of the total comprises sand, clay, gravel, and cement used for building, along with the other minerals mined to produce fertilizer. Coal, oil, and gas make up 15% of the total, while metal makes up 10%. The final quarter are plants and trees used for food and fuel.


Misc
The Top 25 Nationalities of U.S. Immigrants
Mexico is the largest source of immigrants to the U.S., with almost 11 million immigrants.


The Top 25 Nationalities of U.S. Immigrants
This was originally posted on our Voronoi app. Download the app for free on iOS or Android and discover incredible data-driven charts from a variety of trusted sources.
The United States is home to more than 46 million immigrants, constituting approximately 14% of its total population.
This graphic displays the top 25 countries of origin for U.S. immigrants, based on 2022 estimates. The data is sourced from the Migration Policy Institute (MPI), which analyzed information from the U.S. Census Bureau’s 2022 American Community Survey.
In this context, “immigrants” refer to individuals residing in the United States who were not U.S. citizens at birth.
Mexico Emerges as a Leading Source of Immigration
Mexico stands out as the largest contributor to U.S. immigration due to its geographical proximity and historical ties.
Various economic factors, including wage disparities and employment opportunities, motivate many Mexicans to seek better prospects north of the border.
| Country | Region | # of Immigrants |
|---|---|---|
| 🇲🇽 Mexico | Latin America & Caribbean | 10,678,502 |
| 🇮🇳 India | Asia | 2,839,618 |
| 🇨🇳 China | Asia | 2,217,894 |
| 🇵🇭 Philippines | Asia | 1,982,333 |
| 🇸🇻 El Salvador | Latin America & Caribbean | 1,407,622 |
| 🇻🇳 Vietnam | Asia | 1,331,192 |
| 🇨🇺 Cuba | Latin America & Caribbean | 1,312,510 |
| 🇩🇴 Dominican Republic | Latin America & Caribbean | 1,279,900 |
| 🇬🇹 Guatemala | Latin America & Caribbean | 1,148,543 |
| 🇰🇷 Korea | Asia | 1,045,100 |
| 🇨🇴 Colombia | Latin America & Caribbean | 928,053 |
| 🇭🇳 Honduras | Latin America & Caribbean | 843,774 |
| 🇨🇦 Canada | Northern America | 821,322 |
| 🇯🇲 Jamaica | Latin America & Caribbean | 804,775 |
| 🇭🇹 Haiti | Latin America & Caribbean | 730,780 |
| 🇬🇧 United Kingdom | Europe | 676,652 |
| 🇻🇪 Venezuela | Latin America & Caribbean | 667,664 |
| 🇧🇷 Brazil | Latin America & Caribbean | 618,525 |
| 🇩🇪 Germany | Europe | 537,484 |
| 🇪🇨 Ecuador | Latin America & Caribbean | 518,287 |
| 🇵🇪 Peru | Latin America & Caribbean | 471,988 |
| 🇳🇬 Nigeria | Africa | 448,405 |
| 🇺🇦 Ukraine | Europe | 427,163 |
| 🇮🇷 Iran | Middle East | 407,283 |
| 🇵🇰 Pakistan | Asia | 399,086 |
| Rest of World | 11,637,634 | |
| Total | 46,182,089 |
Mexicans are followed in this ranking by Indians, Chinese, and Filipinos, though most immigrants on this list come from countries in the Latin American and Caribbean region.
On the other hand, only three European countries are among the top sources of U.S. immigrants: the UK, Germany, and Ukraine.
Immigration continues to be a significant factor contributing to the overall growth of the U.S. population. Overall population growth has decelerated over the past decade primarily due to declining birth rates.
Between 2021 and 2022, the increase in the immigrant population accounted for 65% of the total population growth in the U.S., representing 912,000 individuals out of nearly 1.4 million.
If you enjoyed this post, be sure to check out Visualized: Why Do People Immigrate to the U.S.? This visualization shows the different reasons cited by new arrivals to America in 2021.

-

 Personal Finance1 week ago
Visualizing the Tax Burden of Every U.S. State
-

 Misc6 days ago
Visualized: Aircraft Carriers by Country
-

 Culture6 days ago
How Popular Snack Brand Logos Have Changed
-

 Mining1 week ago
Visualizing Copper Production by Country in 2023
-

 Misc1 week ago
Charted: How Americans Feel About Federal Government Agencies
-

 Healthcare1 week ago
Which Countries Have the Highest Infant Mortality Rates?
-

 Demographics1 week ago
Mapped: U.S. Immigrants by Region
-

 Maps1 week ago
Mapped: Southeast Asia’s GDP Per Capita, by Country