Misc
Visualizing Women’s Economic Rights Around the World


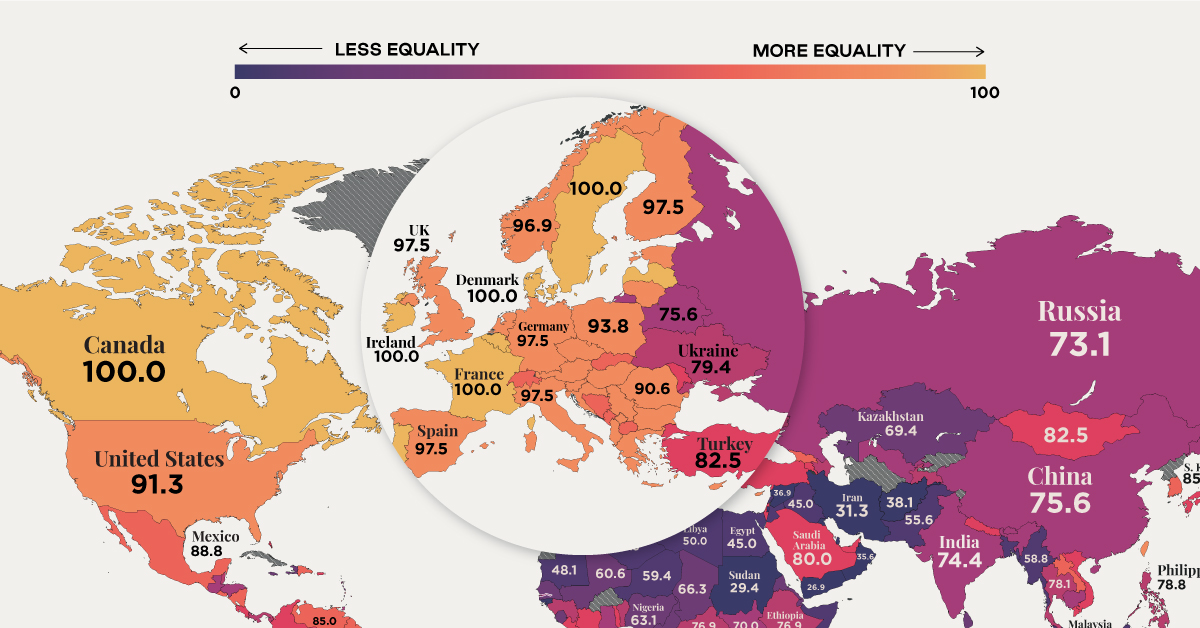
Visualizing Women’s Economic Rights in Each Country
In recent years, many economies have made women’s rights a priority by eliminating job restrictions, working to reduce the gender wage gap, or changing legislation related to marriage and parenthood.
Still, many laws continue to inhibit women’s ability to enter the workforce or start a business—and even to travel outside their homes in the same way as men. In fact, on average globally, women have just three-quarters of the economic rights of men.
This map uses data from the Women, Business and Law 2021 report by the World Bank, to visualize women’s economic rights around the world.
Legal Protections
According to the World Bank, only 10 countries offer full legal protections to women, and all of them are in the Northern Hemisphere.
In ranking countries, the institution considers indicators like equal remuneration, legal rights, and mobility. A score of 100 means that women are on equal legal standing with men across all areas measured.
| Rank | Country/Territory | Score |
|---|---|---|
| 1 | Belgium | 100.0 |
| 1 | Canada | 100.0 |
| 1 | Denmark | 100.0 |
| 1 | France | 100.0 |
| 1 | Iceland | 100.0 |
| 1 | Ireland | 100.0 |
| 1 | Latvia | 100.0 |
| 1 | Luxembourg | 100.0 |
| 1 | Portugal | 100.0 |
| 1 | Sweden | 100.0 |
| 2 | Estonia | 97.5 |
| 2 | Finland | 97.5 |
| 2 | Germany | 97.5 |
| 2 | Greece | 97.5 |
| 2 | Italy | 97.5 |
| 2 | Netherlands | 97.5 |
| 2 | New Zealand | 97.5 |
| 2 | Spain | 97.5 |
| 2 | United Kingdom | 97.5 |
| 3 | Australia | 96.9 |
| 3 | Austria | 96.9 |
| 3 | Hungary | 96.9 |
| 3 | Norway | 96.9 |
| 3 | Slovenia | 96.9 |
| 4 | Peru | 95.0 |
| 5 | Paraguay | 94.4 |
| 6 | Croatia | 93.8 |
| 6 | Czech Republic | 93.8 |
| 6 | Lithuania | 93.8 |
| 6 | Poland | 93.8 |
| 6 | Serbia | 93.8 |
| 7 | Kosovo | 91.9 |
| 7 | Mauritius | 91.9 |
| 8 | Albania | 91.3 |
| 8 | Cyprus | 91.3 |
| 8 | Taiwan, China | 91.3 |
| 8 | United States | 91.3 |
| 9 | Bulgaria | 90.6 |
| 9 | Romania | 90.6 |
| 10 | Ecuador | 89.4 |
| 10 | Hong Kong, China | 89.4 |
| 11 | Bolivia | 88.8 |
| 11 | El Salvador | 88.8 |
| 11 | Malta | 88.8 |
| 11 | Mexico | 88.8 |
| 11 | Uruguay | 88.8 |
| 12 | Lao PDR | 88.1 |
| 12 | Montenegro | 88.1 |
| 12 | South Africa | 88.1 |
| 13 | Guyana | 86.9 |
| 13 | Zimbabwe | 86.9 |
| 14 | Cabo Verde | 86.3 |
| 14 | Dominican Republic | 86.3 |
| 14 | Namibia | 86.3 |
| 14 | Nicaragua | 86.3 |
| 14 | São Tomé and Príncipe | 86.3 |
| 15 | Georgia | 85.6 |
| 15 | Switzerland | 85.6 |
| 16 | Bosnia and Herzegovina | 85.0 |
| 16 | Brazil | 85.0 |
| 16 | Korea, Rep. | 85.0 |
| 16 | North Macedonia | 85.0 |
| 16 | Slovak Republic | 85.0 |
| 16 | Venezuela | 85.0 |
| 17 | Moldova | 84.4 |
| 17 | Togo | 84.4 |
| 18 | Liberia | 83.8 |
| 18 | Puerto Rico (US) | 83.8 |
| 18 | St. Lucia | 83.8 |
| 19 | Costa Rica | 83.1 |
| 19 | Côte d'Ivoire | 83.1 |
| 19 | Timor-Leste | 83.1 |
| 20 | Armenia | 82.5 |
| 20 | Fiji | 82.5 |
| 20 | Mongolia | 82.5 |
| 20 | Mozambique | 82.5 |
| 20 | Singapore | 82.5 |
| 20 | Turkey | 82.5 |
| 20 | United Arab Emirates | 82.5 |
| 21 | Colombia | 81.9 |
| 21 | Japan | 81.9 |
| 21 | Vietnam | 81.9 |
| 22 | Bahamas | 81.3 |
| 22 | Tanzania | 81.3 |
| 22 | Zambia | 81.3 |
| 23 | Grenada | 80.6 |
| 23 | Israel | 80.6 |
| 23 | Kenya | 80.6 |
| 23 | Nepal | 80.6 |
| 23 | Rwanda | 80.6 |
| 24 | Chile | 80.0 |
| 24 | Samoa | 80.0 |
| 24 | San Marino | 80.0 |
| 24 | Saudi Arabia | 80.0 |
| 25 | Belize | 79.4 |
| 25 | Burkina Faso | 79.4 |
| 25 | Panama | 79.4 |
| 25 | Ukraine | 79.4 |
| 26 | Azerbaijan | 78.8 |
| 26 | Congo, Dem. Rep. | 78.8 |
| 26 | Kiribati | 78.8 |
| 26 | Philippines | 78.8 |
| 26 | Tajikistan | 78.8 |
| 27 | Lesotho | 78.1 |
| 27 | Thailand | 78.1 |
| 28 | Benin | 77.5 |
| 28 | Malawi | 77.5 |
| 29 | Barbados | 76.9 |
| 29 | Central African Republic | 76.9 |
| 29 | Ethiopia | 76.9 |
| 29 | Kyrgyz Republic | 76.9 |
| 30 | Argentina | 76.3 |
| 30 | Guinea | 76.3 |
| 30 | Seychelles | 76.3 |
| 31 | Belarus | 75.6 |
| 31 | China | 75.6 |
| 31 | Morocco | 75.6 |
| 32 | Cambodia | 75.0 |
| 32 | Ghana | 75.0 |
| 32 | Honduras | 75.0 |
| 32 | Trinidad and Tobago | 75.0 |
| 33 | Gambia | 74.4 |
| 33 | India | 74.4 |
| 33 | Madagascar | 74.4 |
| 34 | Maldives | 73.8 |
| 34 | Suriname | 73.8 |
| 35 | Angola | 73.1 |
| 35 | Burundi | 73.1 |
| 35 | Russia | 73.1 |
| 35 | Uganda | 73.1 |
| 36 | Bhutan | 71.9 |
| 37 | St. Kitts and Nevis | 71.3 |
| 38 | Guatemala | 70.6 |
| 38 | Uzbekistan | 70.6 |
| 39 | South Sudan | 70.0 |
| 40 | Eritrea | 69.4 |
| 40 | Kazakhstan | 69.4 |
| 40 | Sierra Leone | 69.4 |
| 41 | Dijibouti | 68.1 |
| 41 | Jamaica | 68.1 |
| 41 | Marshall Islands | 68.1 |
| 41 | St. Vicent and the Grenadines | 68.1 |
| 42 | Tunisia | 67.5 |
| 43 | Senegal | 66.9 |
| 44 | Antigua and Barbuda | 66.3 |
| 44 | Chad | 66.3 |
| 45 | Sri Lanka | 65.6 |
| 46 | Comoros | 65.0 |
| 47 | Indonesia | 64.4 |
| 48 | Botswana | 63.8 |
| 48 | Haiti | 63.8 |
| 48 | Micronesia | 63.8 |
| 49 | Nigeria | 63.1 |
| 50 | Dominica | 62.5 |
| 51 | Mali | 60.6 |
| 52 | Cameroon | 60.0 |
| 52 | Papua New Guinea | 60.0 |
| 53 | Niger | 59.4 |
| 54 | Myanmar | 58.8 |
| 54 | Palau | 58.8 |
| 54 | Tonga | 58.8 |
| 55 | Vanuatu | 58.1 |
| 56 | Algeria | 57.5 |
| 56 | Gabon | 57.5 |
| 57 | Solomon Islands | 56.9 |
| 58 | Bahrain | 55.6 |
| 58 | Pakistan | 55.6 |
| 59 | Brunei Darussalam | 53.1 |
| 60 | Lebanon | 52.5 |
| 61 | Equatorial Guinea | 51.9 |
| 62 | Libya | 50.0 |
| 62 | Malaysia | 50.0 |
| 63 | Bangladesh | 49.4 |
| 63 | Congo, Rep. | 49.4 |
| 64 | Mauritania | 48.1 |
| 65 | Jordan | 46.9 |
| 65 | Somalia | 46.9 |
| 66 | Eswatini | 46.3 |
| 67 | Egypt | 45.0 |
| 67 | Iraq | 45.0 |
| 68 | Guinea-Bissau | 42.5 |
| 69 | Afghanistan | 38.1 |
| 70 | Syria | 36.9 |
| 71 | Oman | 35.6 |
| 72 | Iran | 31.3 |
| 73 | Qatar | 29.4 |
| 73 | Sudan | 29.4 |
| 74 | Kuwait | 28.8 |
| 75 | Yemen | 26.9 |
| 76 | West Bank and Gaza | 26.3 |
According to the report, there are 20 economies in the world where women still have half or fewer of the legal economic rights of men.
Under Taliban rule, for example, women in Afghanistan have limited access to education and work. In the Gaza Strip, women must have the permission of a male guardian to travel.
Yet, some differences are also seen in developed countries.
In the U.S, women still earn an average of about 82 cents for each dollar earned by men, and the gap across many countries in Europe is similar. Meanwhile, women are represented in just 23% of seats in national parliaments globally, and make up just 13% of agricultural landholders.
The Shadow Pandemic
COVID-19 has exacerbated existing inequalities that disadvantage girls and women, including barriers to attend school and maintain jobs, according to the United Nations.
In fact, new research shows that the sectors that have been most affected by the pandemic so far are those with high levels of women workers, including the restaurant and hospitality business, as well as the travel sector.
While leaders debate recovery in a post-pandemic world, rights equality remains a central topic for social and economic development.


Maps
Mapped: The 10 U.S. States With the Lowest Real GDP Growth
In this graphic, we show where real GDP lagged the most across America in 2023 as high interest rates weighed on state economies.


The Top 10 U.S. States, by Lowest Real GDP Growth
This was originally posted on our Voronoi app. Download the app for free on iOS or Android and discover incredible data-driven charts from a variety of trusted sources.
While the U.S. economy defied expectations in 2023, posting 2.5% in real GDP growth, several states lagged behind.
Last year, oil-producing states led the pack in terms of real GDP growth across America, while the lowest growth was seen in states that were more sensitive to the impact of high interest rates, particularly due to slowdowns in the manufacturing and finance sectors.
This graphic shows the 10 states with the least robust real GDP growth in 2023, based on data from the Bureau of Economic Analysis.
Weakest State Economies in 2023
Below, we show the states with the slowest economic activity in inflation-adjusted terms, using chained 2017 dollars:
| Rank | State | Real GDP Growth 2023 YoY | Real GDP 2023 |
|---|---|---|---|
| 1 | Delaware | -1.2% | $74B |
| 2 | Wisconsin | +0.2% | $337B |
| 3 | New York | +0.7% | $1.8T |
| 4 | Missississippi | +0.7% | $115B |
| 5 | Georgia | +0.8% | $661B |
| 6 | Minnesota | +1.2% | $384B |
| 7 | New Hampshire | +1.2% | $91B |
| 8 | Ohio | +1.2% | $698B |
| 9 | Iowa | +1.3% | $200B |
| 10 | Illinois | +1.3% | $876B |
| U.S. | +2.5% | $22.4T |
Delaware witnessed the slowest growth in the country, with real GDP growth of -1.2% over the year as a sluggish finance and insurance sector dampened the state’s economy.
Like Delaware, the Midwestern state of Wisconsin also experienced declines across the finance and insurance sector, in addition to steep drops in the agriculture and manufacturing industries.
America’s third-biggest economy, New York, grew just 0.7% in 2023, falling far below the U.S. average. High interest rates took a toll on key sectors, with notable slowdowns in the construction and manufacturing sectors. In addition, falling home prices and a weaker job market contributed to slower economic growth.
Meanwhile, Georgia experienced the fifth-lowest real GDP growth rate. In March 2024, Rivian paused plans to build a $5 billion EV factory in Georgia, which was set to be one of the biggest economic development initiatives in the state in history.
These delays are likely to exacerbate setbacks for the state, however, both Kia and Hyundai have made significant investments in the EV industry, which could help boost Georgia’s manufacturing sector looking ahead.

-

 Technology1 week ago
Countries With the Highest Rates of Crypto Ownership
-

 Mining6 days ago
Visualizing Copper Production by Country in 2023
-

 Politics7 days ago
Charted: How Americans Feel About Federal Government Agencies
-

 Healthcare1 week ago
Which Countries Have the Highest Infant Mortality Rates?
-

 Demographics1 week ago
Mapped: U.S. Immigrants by Region
-

 Economy1 week ago
Mapped: Southeast Asia’s GDP Per Capita, by Country
-

 Automotive1 week ago
How People Get Around in America, Europe, and Asia
-

 Personal Finance1 week ago
Visualizing the Tax Burden of Every U.S. State