Technology
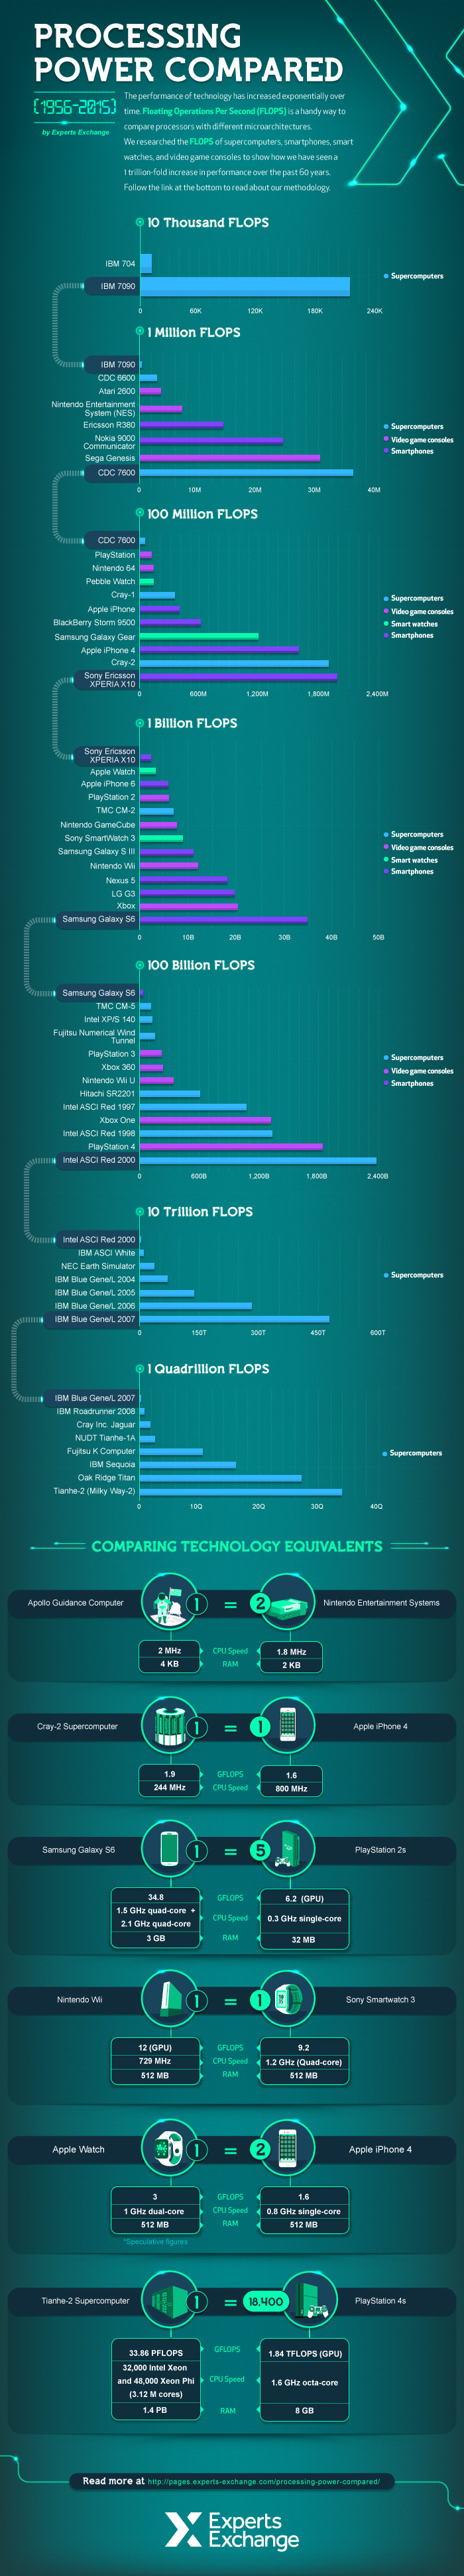
Visualizing the Trillion-Fold Increase in Computing Power
On July 20, 1969, millions of people received an inspirational jolt from watching two brave astronauts take humankind’s first steps on the moon. Rightly so, those astronauts, Neil Armstrong and Buzz Aldrin, are now household names to many – however, their Apollo Guidance Computer (AGC) remains the unsung hero that made their moon landing possible in the first place.
With processing power equivalent to a pair of Nintendo consoles, the AGC wasn’t flashy. But despite its technical limitations, the AGC functioned admirably as the interface for guidance, navigation, and control of the spacecraft to get humans to their first lunar destination.
To Infinity and Beyond?
If a pair of Nintendo consoles can get us to the moon, there’s no telling what the future may hold as computing power continues to grow.
Today’s infographic comes to us from Experts Exchange, and it visualizes the 1 trillion-fold increase in computing performance from 1956 to 2015.
The Incredible Shrinking Hard Disk
In the 1970s, data storage equipment was serious business. The IBM 305 RAMAC, for example, weighed a ton and measured 16 square feet. The RAMAC’s storage capacity? Just 5MB.
Thankfully, hard disks are no longer the size of filing cabinets. The animation below visualizes just how compact terabytes of storage have become.
Computing in the Real World
A relatable touchpoint for many people will be ever-changing graphics quality of video games.
The journey from Atari’s pixelated stick figures to today’s crisp, hyper-realistic graphics is a surprisingly good visual aid to help us understand increases in computing power over many years.

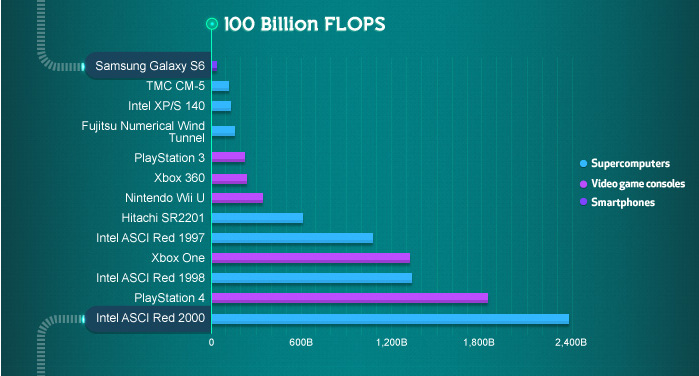
The journey from Pong to Call of Duty is inexorably linked to processing power. As the comprehensive list below demonstrates, modern gaming systems are so powerful that even the revolutionary Xbox 360 now looks quaint in comparison.
| YEAR | MFLOPS | CONSOLE |
|---|---|---|
| 1976 | 0 | Fairchild Channel F (Pong) |
| 1977 | 0 | Atari 2600 |
| 1983 | 0 | NES |
| 1986 | 0 | Atari 7800 |
| 1988 | 0 | Sega Genesis |
| 1990 | 0 | SNES |
| 1991 | 0 | Sega CD |
| 1994 | 0 | Sony PlayStation |
| 1994 | 0 | Sega Saturn |
| 1996 | 200 | Nintendo 64 |
| 2000 | 6,200 | Sony PlayStation 2 |
| 2005 | 240,000 | Xbox 360 |
| 2006 | 459,200 | Sony PlayStation 3 |
| 2013 | 1,228,800 | Xbox One |
| 2013 | 1,843,200 | Sony PlayStation 4 |
Our ExaFLOP Future
Though performance drivers are flattening out, supercomputing continues to hit new milestones. The next one on the list is exascale computing – and at that level, machines will be capable of a million-trillion calculations a second.
Why do we even need computers that powerful? For one, some of the biggest challenges facing humankind are extremely complicated, and we just don’t have the computing power to tackle them as effectively as we could. Two relevant examples are climate modeling and life sciences.
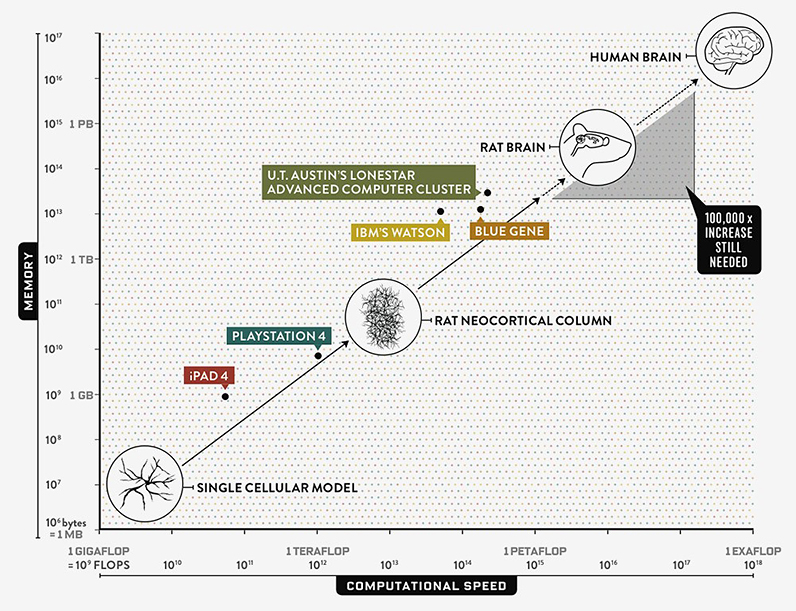
All these advances are pushing us closer to a major symbolic milestone: computers as powerful and complex as the human brain.


Technology
Countries With the Highest Rates of Crypto Ownership
While the U.S. is a major market for cryptocurrencies, two countries surpass it in terms of their rates of crypto ownership.


Countries With the Highest Rates of Crypto Ownership
This was originally posted on our Voronoi app. Download the app for free on iOS or Android and discover incredible data-driven charts from a variety of trusted sources.
This graphic ranks the top 10 countries by their rate of cryptocurrency ownership, which is the percentage of the population that owns crypto. These figures come from crypto payment gateway, Triple-A, and are as of 2023.
Data and Highlights
The table below lists the rates of crypto ownership in the top 10 countries, as well as the number of people this amounts to.
| Country | % of Population Who Own Crypto | # of Crypto Owners |
|---|---|---|
| 🇦🇪 United Arab Emirates | 30.4 | 3M |
| 🇻🇳 Vietnam | 21.2 | 21M |
| 🇺🇸 U.S. | 15.6 | 53M |
| 🇮🇷 Iran | 13.5 | 12M |
| 🇵🇭 Philippines | 13.4 | 16M |
| 🇧🇷 Brazil | 12 | 26M |
| 🇸🇦 Saudi Arabia | 11.4 | 4M |
| 🇸🇬 Singapore | 11.1 | 665K |
| 🇺🇦 Ukraine | 10.6 | 4M |
| 🇻🇪 Venezuela | 10.3 | 3M |
Note that if we were to rank countries based on their actual number of crypto owners, India would rank first at 93 million people, China would rank second at 59 million people, and the U.S. would rank third at 52 million people.
The UAE Takes the Top Spot
The United Arab Emirates (UAE) boasts the highest rates of crypto ownership globally. The country’s government is considered to be very crypto friendly, as described in Henley & Partners’ Crypto Wealth Report 2023:
In the UAE, the Financial Services Regulatory Authority (FSRA-ADGM) was the first to provide rules and regulations regarding cryptocurrency purchasing and selling. The Emirates are generally very open to new technologies and have proposed zero taxes for crypto owners and businesses.
Vietnam leads Southeast Asia
According to the Crypto Council for Innovation, cryptocurrency holdings in Vietnam are also untaxed, making them an attractive asset.
Another reason for Vietnam’s high rates of ownership could be its large unbanked population (people without access to financial services). Cryptocurrencies may provide an alternative means of accessing these services without relying on traditional banks.
Learn More About Crypto From Visual Capitalist
If you enjoyed this post, be sure to check out The World’s Largest Corporate Holders of Bitcoin, which ranks the top 12 publicly traded companies by their Bitcoin holdings.

-

 Markets6 days ago
Mapped: Europe’s GDP Per Capita, by Country
-

 Energy2 weeks ago
Mapped: The Age of Energy Projects in Interconnection Queues, by State
-

 Mining2 weeks ago
Visualizing Global Gold Production in 2023
-

 Markets2 weeks ago
Visualized: Interest Rate Forecasts for Advanced Economies
-

 Economy2 weeks ago
The Most Valuable Companies in Major EU Economies
-

 Markets1 week ago
The World’s Fastest Growing Emerging Markets (2024-2029 Forecast)
-

 Markets1 week ago
Visualizing Global Inflation Forecasts (2024-2026)
-

 United States1 week ago
Charted: What Southeast Asia Thinks About China & the U.S.