Technology
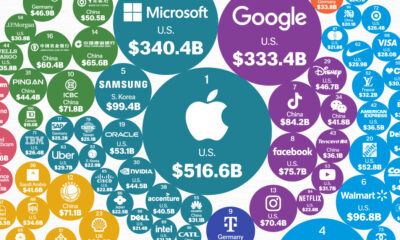
The World’s Fastest Growing Brands in 2017, by Value
The Chart of the Week is a weekly Visual Capitalist feature on Fridays.
In a modern business era of near-constant disruption, which brands are winning the hearts of consumers the fastest?
Today’s charts look at the brands that are trending upwards. See below for the brands that have gained the most in brand value since last year, as assessed by BrandZ in their report on the world’s 100 most valuable brands.
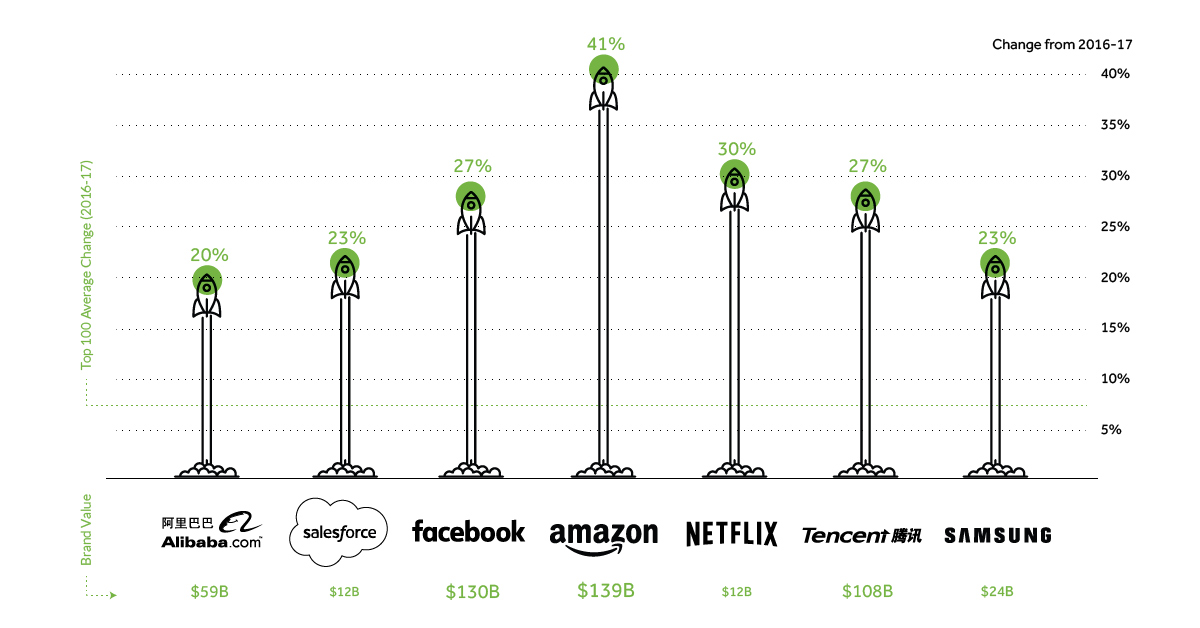
Onwards and Upwards for Tech
As many big name brands try to find their footing in today’s fast-paced consumer environment, it’s not surprising to see up-and-coming tech brands skyrocketing in value.
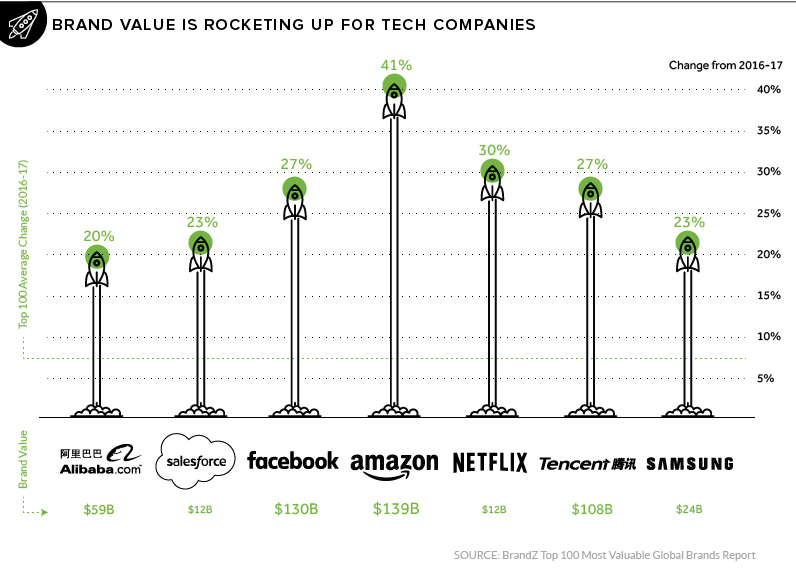
In line with growing revenues, tech brands like Amazon, Facebook, and Netflix are also flying high with their brands. Amazon, for example, had its brand value soar 41% since last year to make it the fourth most valuable brand in the world at $139 billion. Chinese tech companies are gaining traction in the eyes of consumers as well, with Tencent and Alibaba both growing their brand values at clips of 20% or higher.
Note: the measure of “brand value”, not to be confused with company valuation metrics like market cap, is a way of quantifying the dollar value that a particular brand’s image is contributing to the overall value of a corporation.
Other Big Movers
Although tech brands seem to be moving up the list in unison, it’s also worth examining the brands in other sectors that have seen their brand values rapidly increase.
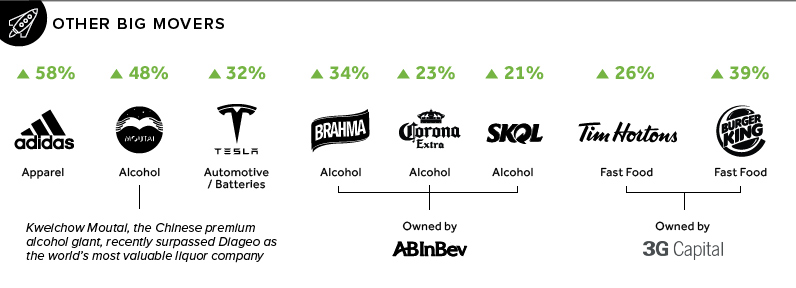
The brands seen here have some interesting commonalities and points worth noting.
Firstly, despite not being a tech brand, Adidas was actually the fastest-growing brand in the whole report with a 58% increase in brand value from 2016 to 2017. According to the analysis, the apparel brand saw its retro sneakers “connect perfectly” with the fashion moment.
Next, alcohol brands also generally performed admirably. Three of the brands that had double-digit growth were owned by the world’s largest beer company, AB InBev – and two of those brands (Skol and Brahma) are Brazilian. Further, Kweichow Moutai, a Chinese liquor maker that surpassed Diageo earlier this year in market capitalization, is also rising fast.
Also of interest is that two 3G Capital restaurant brands, Burger King and Tim Horton’s, happened to increase substantially in brand value. Of course, 3G Capital owns a stake in the aforementioned AB InBev as well.
New Entrants
The following brands are the newest entrants on the 2017 edition of the top 100 list:
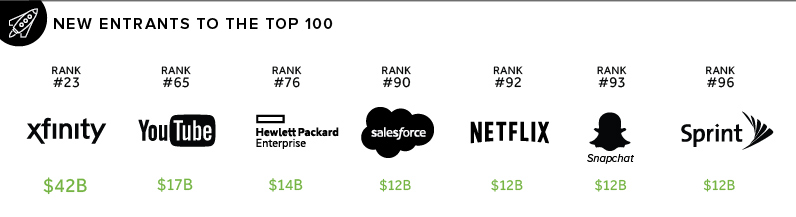
However, as we transition into 2018, these new entrants may have very different fortunes ahead of them.
On one hand, Salesforce has been outlining when it’ll hit $20 billion in sales, and Netflix is still crushing expectations for subscription growth.
On the opposite side of the spectrum, Snap Inc. recently reported slow user growth, which made shares tumble 18% in value. The company’s platform, Snapchat, is locked in a battle with Instagram for users, and it remains to be seen how this will affect both company and brand values down the road.


Technology
Ranked: Semiconductor Companies by Industry Revenue Share
Nvidia is coming for Intel’s crown. Samsung is losing ground. AI is transforming the space. We break down revenue for semiconductor companies.


Semiconductor Companies by Industry Revenue Share
This was originally posted on our Voronoi app. Download the app for free on Apple or Android and discover incredible data-driven charts from a variety of trusted sources.
Did you know that some computer chips are now retailing for the price of a new BMW?
As computers invade nearly every sphere of life, so too have the chips that power them, raising the revenues of the businesses dedicated to designing them.
But how did various chipmakers measure against each other last year?
We rank the biggest semiconductor companies by their percentage share of the industry’s revenues in 2023, using data from Omdia research.
Which Chip Company Made the Most Money in 2023?
Market leader and industry-defining veteran Intel still holds the crown for the most revenue in the sector, crossing $50 billion in 2023, or 10% of the broader industry’s topline.
All is not well at Intel, however, with the company’s stock price down over 20% year-to-date after it revealed billion-dollar losses in its foundry business.
| Rank | Company | 2023 Revenue | % of Industry Revenue |
|---|---|---|---|
| 1 | Intel | $51B | 9.4% |
| 2 | NVIDIA | $49B | 9.0% |
| 3 | Samsung Electronics | $44B | 8.1% |
| 4 | Qualcomm | $31B | 5.7% |
| 5 | Broadcom | $28B | 5.2% |
| 6 | SK Hynix | $24B | 4.4% |
| 7 | AMD | $22B | 4.1% |
| 8 | Apple | $19B | 3.4% |
| 9 | Infineon Tech | $17B | 3.2% |
| 10 | STMicroelectronics | $17B | 3.2% |
| 11 | Texas Instruments | $17B | 3.1% |
| 12 | Micron Technology | $16B | 2.9% |
| 13 | MediaTek | $14B | 2.6% |
| 14 | NXP | $13B | 2.4% |
| 15 | Analog Devices | $12B | 2.2% |
| 16 | Renesas Electronics Corporation | $11B | 1.9% |
| 17 | Sony Semiconductor Solutions Corporation | $10B | 1.9% |
| 18 | Microchip Technology | $8B | 1.5% |
| 19 | Onsemi | $8B | 1.4% |
| 20 | KIOXIA Corporation | $7B | 1.3% |
| N/A | Others | $126B | 23.2% |
| N/A | Total | $545B | 100% |
Note: Figures are rounded. Totals and percentages may not sum to 100.
Meanwhile, Nvidia is very close to overtaking Intel, after declaring $49 billion of topline revenue for 2023. This is more than double its 2022 revenue ($21 billion), increasing its share of industry revenues to 9%.
Nvidia’s meteoric rise has gotten a huge thumbs-up from investors. It became a trillion dollar stock last year, and broke the single-day gain record for market capitalization this year.
Other chipmakers haven’t been as successful. Out of the top 20 semiconductor companies by revenue, 12 did not match their 2022 revenues, including big names like Intel, Samsung, and AMD.
The Many Different Types of Chipmakers
All of these companies may belong to the same industry, but they don’t focus on the same niche.
According to Investopedia, there are four major types of chips, depending on their functionality: microprocessors, memory chips, standard chips, and complex systems on a chip.
Nvidia’s core business was once GPUs for computers (graphics processing units), but in recent years this has drastically shifted towards microprocessors for analytics and AI.
These specialized chips seem to be where the majority of growth is occurring within the sector. For example, companies that are largely in the memory segment—Samsung, SK Hynix, and Micron Technology—saw peak revenues in the mid-2010s.

-

 Green2 weeks ago
Ranked: Top Countries by Total Forest Loss Since 2001
-

 Travel1 week ago
Ranked: The World’s Top Flight Routes, by Revenue
-

 Technology1 week ago
Ranked: Semiconductor Companies by Industry Revenue Share
-

 Money2 weeks ago
Which States Have the Highest Minimum Wage in America?
-

 Real Estate2 weeks ago
Ranked: The Most Valuable Housing Markets in America
-

 Markets2 weeks ago
Charted: Big Four Market Share by S&P 500 Audits
-

 AI2 weeks ago
The Stock Performance of U.S. Chipmakers So Far in 2024
-

 Automotive2 weeks ago
Almost Every EV Stock is Down After Q1 2024