Misc
Map: Visualizing Every Ship at Sea in Real-Time
The ocean is a big place, which makes it a pretty difficult thing to wrap our brains around.
It covers over 70% of the Earth’s surface, is home to millions of species of life, and it makes up 97% of all water on the planet. But, with this massive size and ubiquity also comes a significant challenge for humans interested in trade: it must be constantly traversed in order for us to move goods around.
As a result, millions of people hit the high seas each day to get cargo from one place to another. The vessels used range from tiny sailboats to massive oil tankers, some of which can get up to four football fields in length.
Every Ship at Sea
We previously posted an interactive map of shipping routes that used 250 million data points to show how boats moved across the ocean.
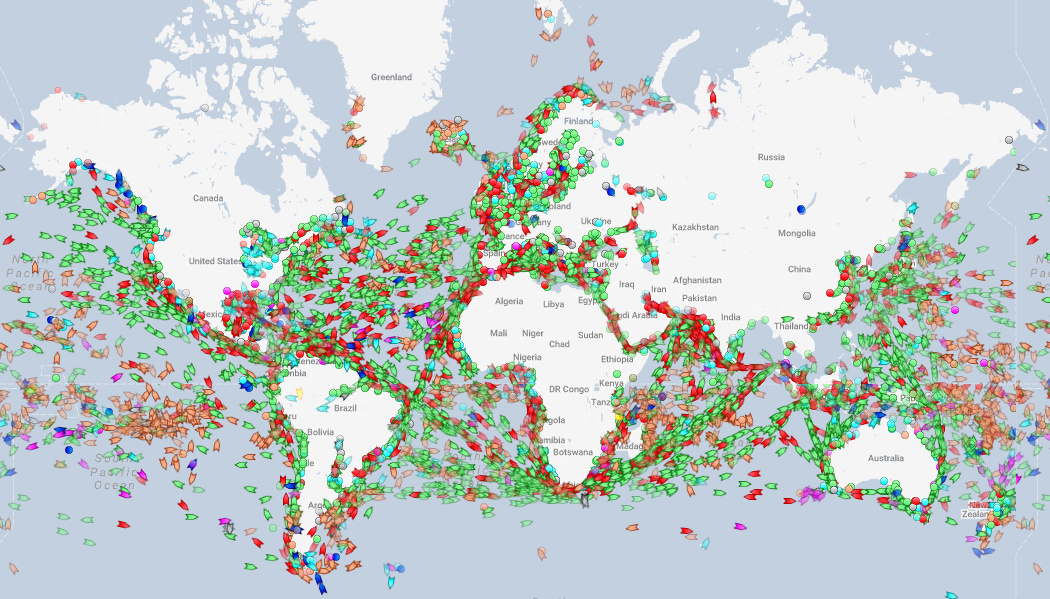
Today, in a similar vein, we highlight a website that tracks the world’s ships in real-time, providing a unique picture of what is happening at sea. Below is a screenshot from MarineTraffic and going there will allow you to see all major ships in real-time as they voyage around the Deep Blue Sea.
You may be wondering, does this really show every ship at sea?
Well, it might not catch your Uncle Steve’s sailboat off the coast of Florida, but this map will show all major commercial vessels. Any oil tanker, cargo vessel, cruise ship, or fishing boat can be spotted, and it makes for some interesting observations if you know where to look.
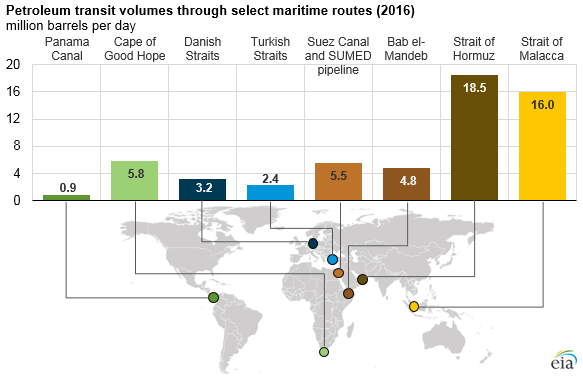
A Look at Oil Chokepoints
Upon loading the real-time map, the first thing we did was adjust the filters to only show oil tankers.
After all, we know that every day, about 18.5 million barrels transit through the Strait of Hormuz between Iran and Oman, and 16 million barrels go through the Strait of Malacca between Indonesia and Malaysia.
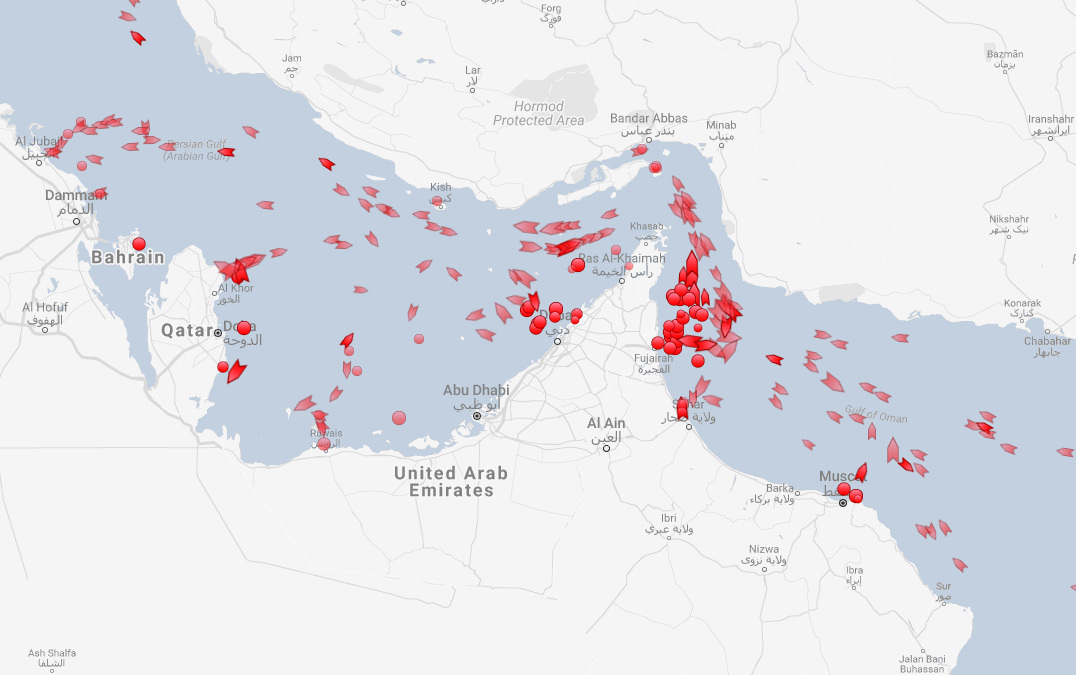
Here’s a screenshot of the Strait of Hormuz, showing only oil tankers. (Dots are tankers that are not moving, while arrows represent tankers that are currently on course.)
And here are the ships going through the Strait of Malacca, which at its narrowest point is only 1.7 miles (2.7 km) wide.
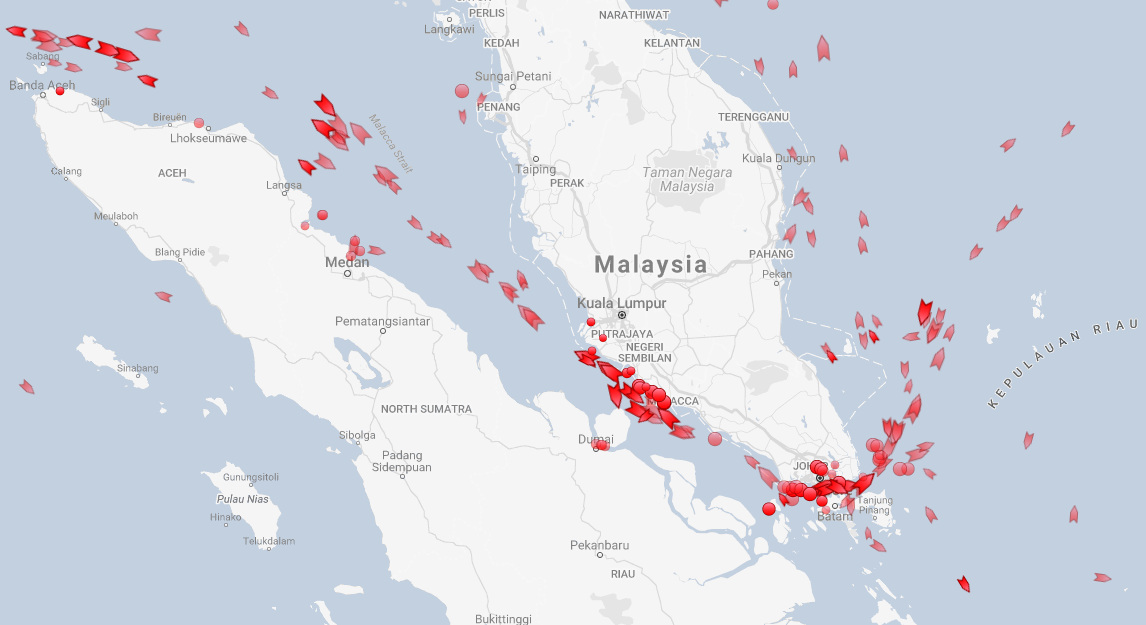
If you want to get oil from the Persian Gulf to the South China Sea, this strait is vital – otherwise a big ship must detour thousands of miles around the Indonesian islands of Sumatra and Java to find the next suitable waterway.
Coast of Somalia
Compare those above straits to the coast off of Somalia, where piracy and hydrocarbon theft are major concerns.
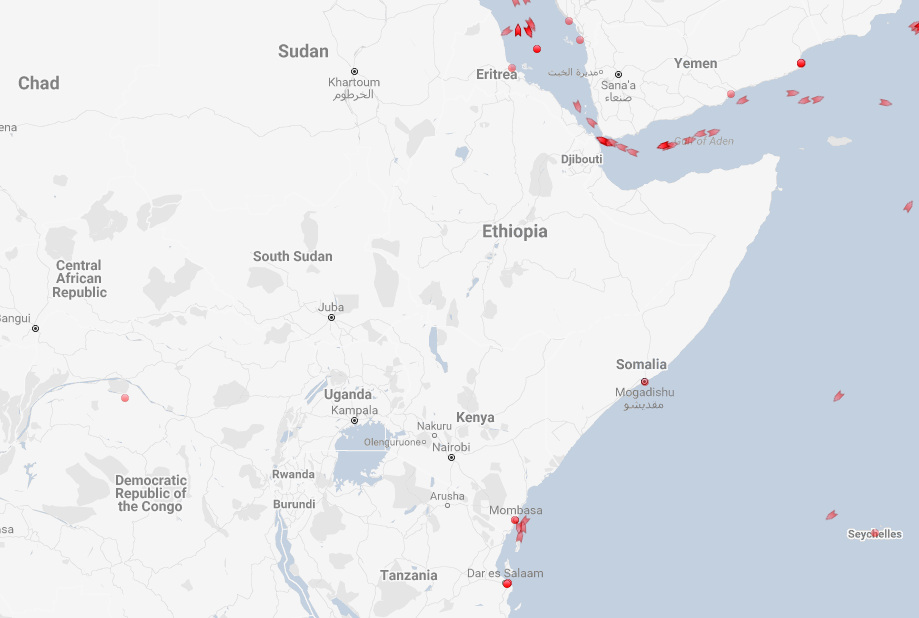
All is pretty quiet, aside from the one daring tanker that is about 500 miles (800 km) east of Mogadishu.
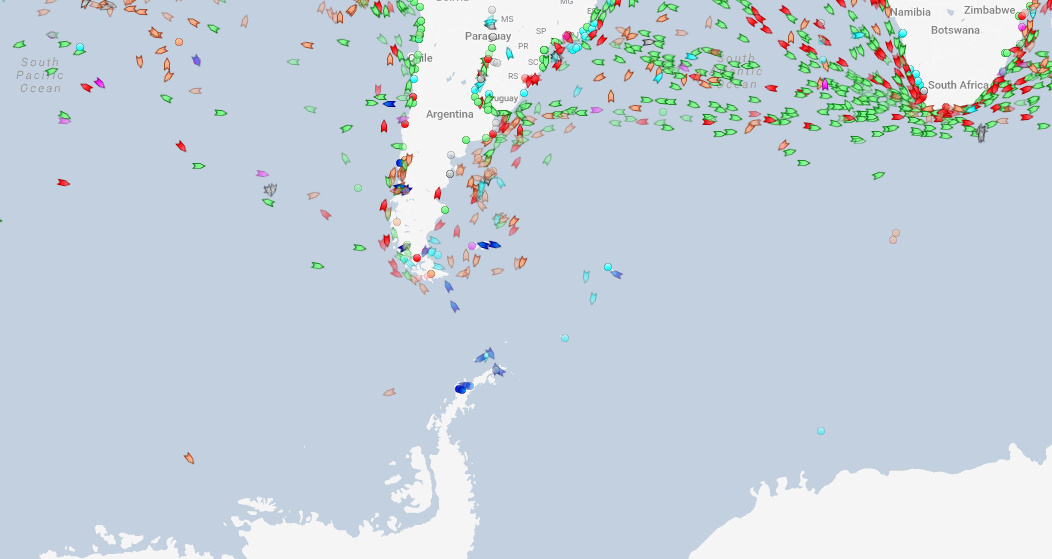
Antarctic Cruises
One other easy observation?
It’s the few passenger boats hanging around the Antarctic Peninsula – which is the part of the continent closest to Argentina and a destination for cruise ships.
If you have a chance, check out the live map for yourself and play around with the filters. It’s also interesting to see what’s happening in your local waters, as well.


Public Opinion
Charted: How Democrats and Republicans View Government Agencies
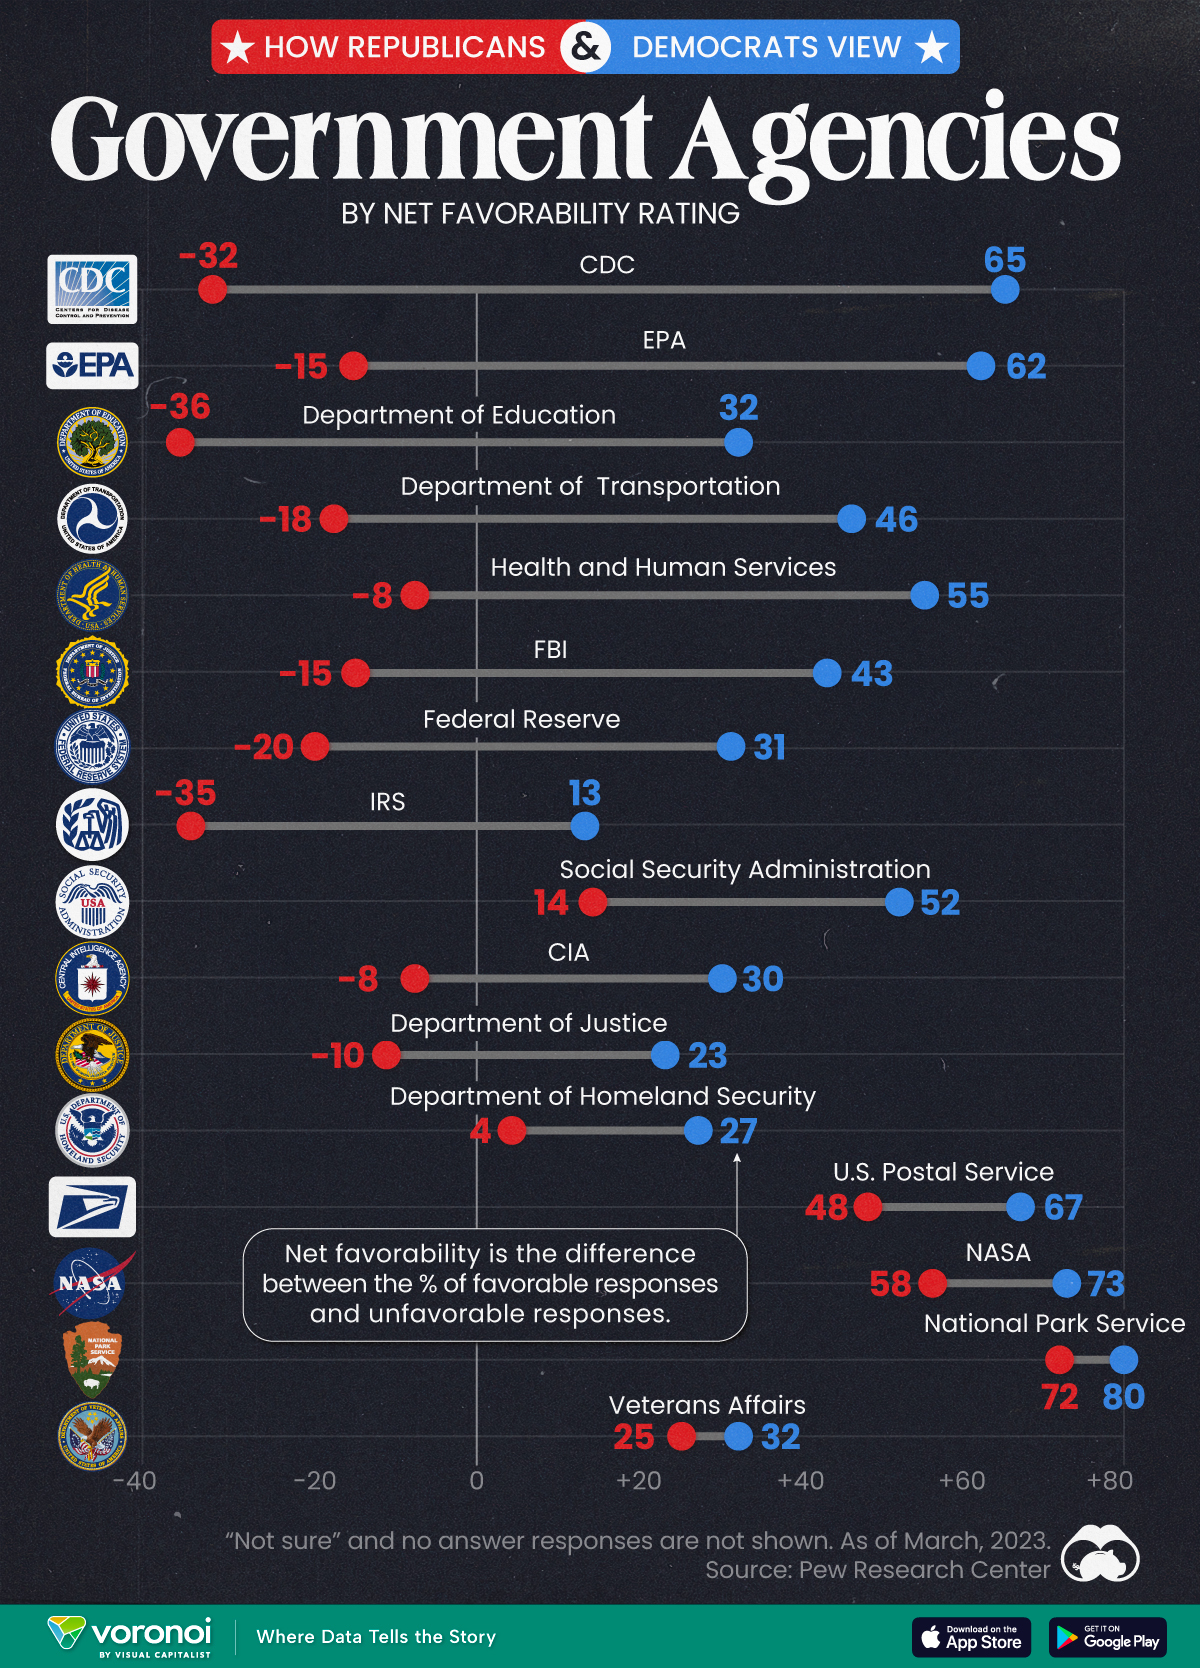
Predictably, results diverge when both Democrats and Republicans are asked to rate key government agencies in the United States.

How Democrats and Republicans View Government Agencies
This was originally posted on our Voronoi app. Download the app for free on iOS or Android and discover incredible data-driven charts from a variety of trusted sources.
Forget the presidential race, the partisan divide in America can also be seen by how Democrats and Republicans feel about key government agencies.
We visualize the net favorability ratings of 16 federal government agencies, based on respondent party affiliation.
To find this data, Pew Research Center surveyed more than 10,000 adults, between March 13-19, 2023. View their methodology page for more details about the survey, the questions asked, and the results obtained.
Republicans Don’t Like How the CDC Handled the Pandemic
The division in net favorability is deepest for three federal government agencies. While the CDC garnered a net favorability rating of 65 from Democrats, more Republicans rated the agency unfavorably, leading to a net favorability rating of -32.
Similarly, with the EPA and the Department of Education, the difference in net favorability between the two voting sides is as high as 70–80 points.
| Federal Agency | Republican Net Favorability Rating | Democrat Net Favorability Rating |
|---|---|---|
| 🔬 CDC | -32 | 65 |
| 🌿 EPA | -15 | 62 |
| 📚 Department of Education | -36 | 32 |
| 🚗 Department of Transportation | -18 | 46 |
| 💉 Health and Humans Services | -8 | 55 |
| 💰 Federal Reserve | -20 | 31 |
| 🕵️ FBI | -15 | 43 |
| 💼 IRS | -35 | 13 |
| 💼 Social Security Admin | 14 | 52 |
| 🕵️♂️ CIA | -8 | 30 |
| ⚖️ Justice Department | -10 | 23 |
| 🛡️ Homeland Security | 4 | 27 |
| 📮 USPS | 48 | 67 |
| 🚀 NASA | 58 | 73 |
| 🏞️ Park Service | 72 | 80 |
| 🎖️ Veterans Affairs | 25 | 32 |
Pew Research Center notes that Republicans didn’t always view the CDC quite so unfavorably, though a direct comparison is impossible.
Nevertheless, per the source, in March 2020, 84% of surveyed Republicans expressed positive views of the CDC’s performance. By October 2022, just 32% said the CDC had done an excellent or good job of handling the pandemic.
Meanwhile, there are a few agencies the two sides do agree on: the National Park Service, the Postal Service, and NASA.
And they both agree on Veterans Affairs as well: though neither share a particularly high opinion of the organization.
Finally, Democrats consistently rate all sixteen agencies on the survey more favorably than Republicans, showing consistency about how each side views the government in general.

-

 Maps7 days ago
Mapped: Southeast Asia’s GDP Per Capita, by Country
-

 Markets2 weeks ago
Visualizing Global Inflation Forecasts (2024-2026)
-

 United States2 weeks ago
Charted: What Southeast Asia Thinks About China & the U.S.
-

 United States2 weeks ago
The Evolution of U.S. Beer Logos
-

 Healthcare1 week ago
What Causes Preventable Child Deaths?
-

 Energy1 week ago
Who’s Building the Most Solar Energy?
-

 Markets1 week ago
Mapped: The Most Valuable Company in Each Southeast Asian Country
-

 Technology1 week ago
Mapped: The Number of AI Startups By Country