Markets
Who Owns the Most Vehicles per Capita, by Country?
![]() See this visualization first on the Voronoi app.
See this visualization first on the Voronoi app.
Who Owns the Most Vehicles per Capita, by Country?
This was originally posted on our Voronoi app. Download the app for free on iOS or Android and discover incredible data-driven charts from a variety of trusted sources.
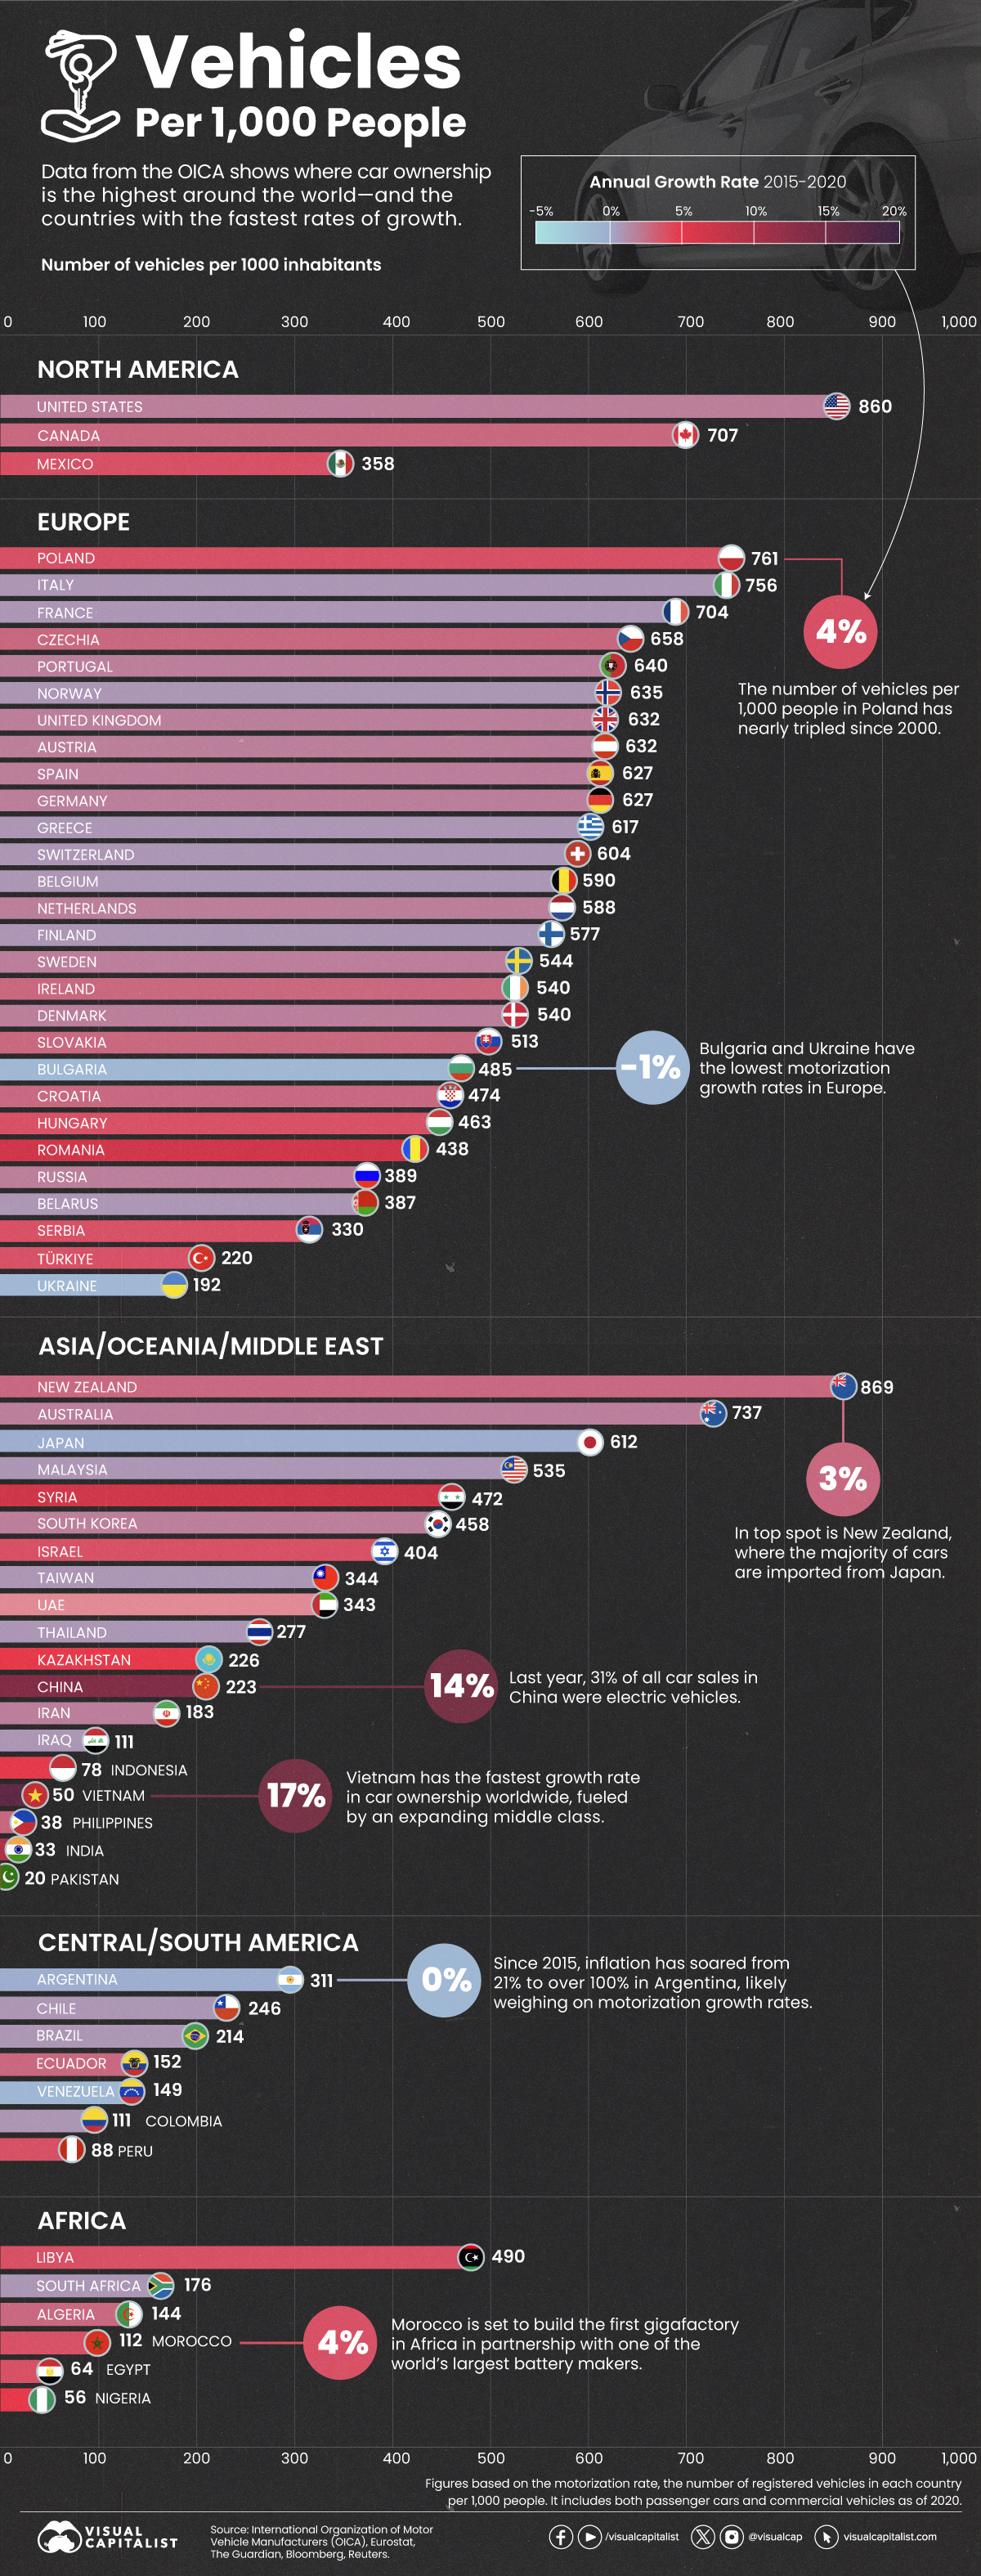
In 2020, there were 289 million vehicles in use in America, or about 18% of the global total.
With one of the largest car ownership rates worldwide, the number of U.S. cars on the road have more than doubled since the 1960s. But how does ownership compare to other countries, and who is seeing the fastest growth rates amid a rising global middle class?
This graphic shows vehicles per capita by country, based on data from the International Organization of Motor Vehicle Manufacturers (OICA).
Highest Car Ownership Rates Worldwide
Below, we rank countries based on the number of registered vehicles in use per 1,000 people, including both passenger cars and commercial vehicles as of 2020:
| Country | Number of Vehicles in Use per 1000 Inhabitants | Average Annual Growth Rate 2015-2020 |
|---|---|---|
| 🇳🇿 New Zealand | 869 | 3% |
| 🇺🇸 U.S. | 860 | 2% |
| 🇵🇱 Poland | 761 | 4% |
| 🇮🇹 Italy | 756 | 1% |
| 🇦🇺 Australia | 737 | 2% |
| 🇨🇦 Canada | 707 | 3% |
| 🇫🇷 France | 704 | 1% |
| 🇨🇿 Czechia | 658 | 3% |
| 🇵🇹 Portugal | 640 | 2% |
| 🇳🇴 Norway | 635 | 1% |
| 🇦🇹 Austria | 632 | 2% |
| 🇬🇧 UK | 632 | 2% |
| 🇩🇪 Germany | 627 | 2% |
| 🇪🇸 Spain | 627 | 2% |
| 🇬🇷 Greece | 617 | 1% |
| 🇯🇵 Japan | 612 | 0% |
| 🇨🇭 Switzerland | 604 | 1% |
| 🇧🇪 Belgium | 590 | 1% |
| 🇳🇱 Netherlands | 588 | 2% |
| 🇫🇮 Finland | 577 | 1% |
| 🇸🇪 Sweden | 544 | 1% |
| 🇩🇰 Denmark | 540 | 2% |
| 🇮🇪 Ireland | 540 | 3% |
| 🇲🇾 Malaysia | 535 | 6% |
| 🇸🇰 Slovakia | 513 | 3% |
| 🇱🇾 Libya | 490 | 4% |
| 🇧🇬 Bulgaria | 485 | -1% |
| 🇭🇷 Croatia | 474 | 3% |
| 🇸🇾 Syria | 472 | 7% |
| 🇭🇺 Hungary | 463 | 4% |
| 🇰🇷 South Korea | 458 | 2% |
| 🇷🇴 Romania | 438 | 7% |
| 🇮🇱 Israel | 404 | 4% |
| 🇷🇺 Russia | 389 | 2% |
| 🇧🇾 Belarus | 387 | 1% |
| 🇲🇽 Mexico | 358 | 4% |
| 🇹🇼 Taiwan | 344 | 1% |
| 🇦🇪 UAE | 343 | 8% |
| 🇷🇸 Serbia | 330 | 4% |
| 🇦🇷 Argentina | 311 | 0% |
| 🇹🇭 Thailand | 277 | 5% |
| 🇨🇱 Chile | 246 | 1% |
| 🇰🇿 Kazakhstan | 226 | -1% |
| 🇨🇳 China | 223 | 14% |
| 🇹🇷 Türkiye | 220 | 4% |
| 🇧🇷 Brazil | 214 | 1% |
| 🇺🇦 Ukraine | 192 | -1% |
| 🇮🇷 Iran | 183 | 2% |
| 🇿🇦 South Africa | 176 | 1% |
| 🇪🇨 Ecuador | 152 | 3% |
| 🇻🇪 Venezuela | 149 | -1% |
| 🇩🇿 Algeria | 144 | 3% |
| 🇲🇦 Morocco | 112 | 4% |
| 🇨🇴 Colombia | 111 | 1% |
| 🇮🇶 Iraq | 111 | 4% |
| 🇵🇪 Peru | 88 | 4% |
| 🇮🇩 Indonesia | 78 | 5% |
| 🇪🇬 Egypt | 64 | 4% |
| 🇳🇬 Nigeria | 56 | 5% |
| 🇻🇳 Vietnam | 50 | 17% |
| 🇵🇭 Philippines | 38 | 3% |
| 🇮🇳 India | 33 | 10% |
| 🇵🇰 Pakistan | 20 | 7% |
Clinching top spot is New Zealand, a country known for its love of cars.
With nearly nine cars on the road to every 10 people, this figure is notably high considering that children make up about 20% of the population. The majority of cars are imported second hand from Japan thanks to a wave of deregulation in the 1980s along with the country being a major producer of right-hand drive cars.
The U.S. falls close behind, with a clear preference for trucks and SUVs. In fact, the Ford F-1 Series has been the best-selling vehicle in America for 42 consecutive years.
In Europe, Poland has the highest number of vehicles per person, but one of the lowest share of electric vehicles (EVs). While EVs make up nearly 16% of all cars in top-ranking country Norway, they comprise 0.1% in Poland. On average, EVs account for 0.8% of passenger cars in the European Union.
Driven by an expanding middle class, Vietnam has seen the fastest growth in ownership. Between 2015 and 2020, the motorization rate grew by an astonishing 17% each year. Additionally, China witnessed 14% growth while India’s vehicles per 1,000 people increased 10% annually over the period.
The Top EV Markets, by Country
As EV sales gain momentum, here are the biggest markets worldwide, based on the number of all-EV cars in use as of 2022:
| Country | Estimated Number of EVs in Use 2022 |
|---|---|
| 🇨🇳 China | 11,000,000 |
| 🇺🇸 U.S. | 2,100,000 |
| 🇩🇪 Germany | 1,000,000 |
| 🇫🇷 France | 620,000 |
| 🇳🇴 Norway | 590,000 |
| 🇬🇧 UK | 550,000 |
| 🇳🇱 Netherlands | 340,000 |
| 🇰🇷 South Korea | 300,000 |
| 🇨🇦 Canada | 250,000 |
| 🇯🇵 Japan | 210,000 |
Source: IEA Global EV Outlook 2023
China is home to over half of the world’s EVs.
Its foothold on the global EV market can be explained by its close proximity to the raw materials used in EV batteries. In fact, China produces roughly 70% of the world’s rare earth metals and has more battery production capacity than all other countries combined.
Adding to this, China developed key government policies that specifically tackled operational hurdles, such as battery constraints, leading to innovation in core technologies. In 2023, EVs made up 31% of all car sales in China, boosted by government incentives and strong consumer demand.
Norway is another leader in the EV market, whose government began introducing EV policies as early as 1990. By 2025, the country aims to phase out internal combustion engine vehicle sales completely. About 80% of all vehicles sales in Norway were EVs in 2022, the highest in the world.


Markets
Mapped: Europe’s GDP Per Capita, by Country
Which European economies are richest on a GDP per capita basis? This map shows the results for 44 countries across the continent.


Mapped: Europe’s GDP Per Capita, by Country (2024)
This was originally posted on our Voronoi app. Download the app for free on iOS or Android and discover incredible data-driven charts from a variety of trusted sources.
Europe is home to some of the largest and most sophisticated economies in the world. But how do countries in the region compare with each other on a per capita productivity basis?
In this map, we show Europe’s GDP per capita levels across 44 nations in current U.S. dollars. Data for this visualization and article is sourced from the International Monetary Fund (IMF) via their DataMapper tool, updated April 2024.
Europe’s Richest and Poorest Nations, By GDP Per Capita
Luxembourg, Ireland, and Switzerland, lead the list of Europe’s richest nations by GDP per capita, all above $100,000.
| Rank | Country | GDP Per Capita (2024) |
|---|---|---|
| 1 | 🇱🇺 Luxembourg | $131,380 |
| 2 | 🇮🇪 Ireland | $106,060 |
| 3 | 🇨🇭 Switzerland | $105,670 |
| 4 | 🇳🇴 Norway | $94,660 |
| 5 | 🇮🇸 Iceland | $84,590 |
| 6 | 🇩🇰 Denmark | $68,900 |
| 7 | 🇳🇱 Netherlands | $63,750 |
| 8 | 🇸🇲 San Marino | $59,410 |
| 9 | 🇦🇹 Austria | $59,230 |
| 10 | 🇸🇪 Sweden | $58,530 |
| 11 | 🇧🇪 Belgium | $55,540 |
| 12 | 🇫🇮 Finland | $55,130 |
| 13 | 🇩🇪 Germany | $54,290 |
| 14 | 🇬🇧 UK | $51,070 |
| 15 | 🇫🇷 France | $47,360 |
| 16 | 🇦🇩 Andorra | $44,900 |
| 17 | 🇲🇹 Malta | $41,740 |
| 18 | 🇮🇹 Italy | $39,580 |
| 19 | 🇨🇾 Cyprus | $37,150 |
| 20 | 🇪🇸 Spain | $34,050 |
| 21 | 🇸🇮 Slovenia | $34,030 |
| 22 | 🇪🇪 Estonia | $31,850 |
| 23 | 🇨🇿 Czech Republic | $29,800 |
| 24 | 🇵🇹 Portugal | $28,970 |
| 25 | 🇱🇹 Lithuania | $28,410 |
| 26 | 🇸🇰 Slovakia | $25,930 |
| 27 | 🇱🇻 Latvia | $24,190 |
| 28 | 🇬🇷 Greece | $23,970 |
| 29 | 🇭🇺 Hungary | $23,320 |
| 30 | 🇵🇱 Poland | $23,010 |
| 31 | 🇭🇷 Croatia | $22,970 |
| 32 | 🇷🇴 Romania | $19,530 |
| 33 | 🇧🇬 Bulgaria | $16,940 |
| 34 | 🇷🇺 Russia | $14,390 |
| 35 | 🇹🇷 Türkiye | $12,760 |
| 36 | 🇲🇪 Montenegro | $12,650 |
| 37 | 🇷🇸 Serbia | $12,380 |
| 38 | 🇦🇱 Albania | $8,920 |
| 39 | 🇧🇦 Bosnia & Herzegovina | $8,420 |
| 40 | 🇲🇰 North Macedonia | $7,690 |
| 41 | 🇧🇾 Belarus | $7,560 |
| 42 | 🇲🇩 Moldova | $7,490 |
| 43 | 🇽🇰 Kosovo | $6,390 |
| 44 | 🇺🇦 Ukraine | $5,660 |
| N/A | 🇪🇺 EU Average | $44,200 |
Note: Figures are rounded.
Three Nordic countries (Norway, Iceland, Denmark) also place highly, between $70,000-90,000. Other Nordic peers, Sweden and Finland rank just outside the top 10, between $55,000-60,000.
Meanwhile, Europe’s biggest economies in absolute terms, Germany, UK, and France, rank closer to the middle of the top 20, with GDP per capitas around $50,000.
Finally, at the end of the scale, Eastern Europe as a whole tends to have much lower per capita GDPs. In that group, Ukraine ranks last, at $5,660.
A Closer Look at Ukraine
For a broader comparison, Ukraine’s per capita GDP is similar to Iran ($5,310), El Salvador ($5,540), and Guatemala ($5,680).
According to experts, Ukraine’s economy has historically underperformed to expectations. After the fall of the Berlin Wall, the economy contracted for five straight years. Its transition to a Western, liberalized economic structure was overshadowed by widespread corruption, a limited taxpool, and few revenue sources.
Politically, its transformation from authoritarian regime to civil democracy has proved difficult, especially when it comes to institution building.
Finally, after the 2022 invasion of the country, Ukraine’s GDP contracted by 30% in a single year—the largest loss since independence. Large scale emigration—to the tune of six million refugees—is also playing a role.
Despite these challenges, the country’s economic growth has somewhat stabilized while fighting continues.

-

 Wealth6 days ago
Charted: What Frustrates Americans About the Tax System
-

 Mining2 weeks ago
Visualizing Global Gold Production in 2023
-

 Markets2 weeks ago
Visualized: Interest Rate Forecasts for Advanced Economies
-

 Economy2 weeks ago
The Most Valuable Companies in Major EU Economies
-

 Markets2 weeks ago
The World’s Fastest Growing Emerging Markets (2024-2029 Forecast)
-

 Markets1 week ago
Visualizing Global Inflation Forecasts (2024-2026)
-

 Politics1 week ago
Charted: What Southeast Asia Thinks About China & the U.S.
-

 Misc1 week ago
The Evolution of U.S. Beer Logos