Misc
The Best Selling Vehicle in Every State
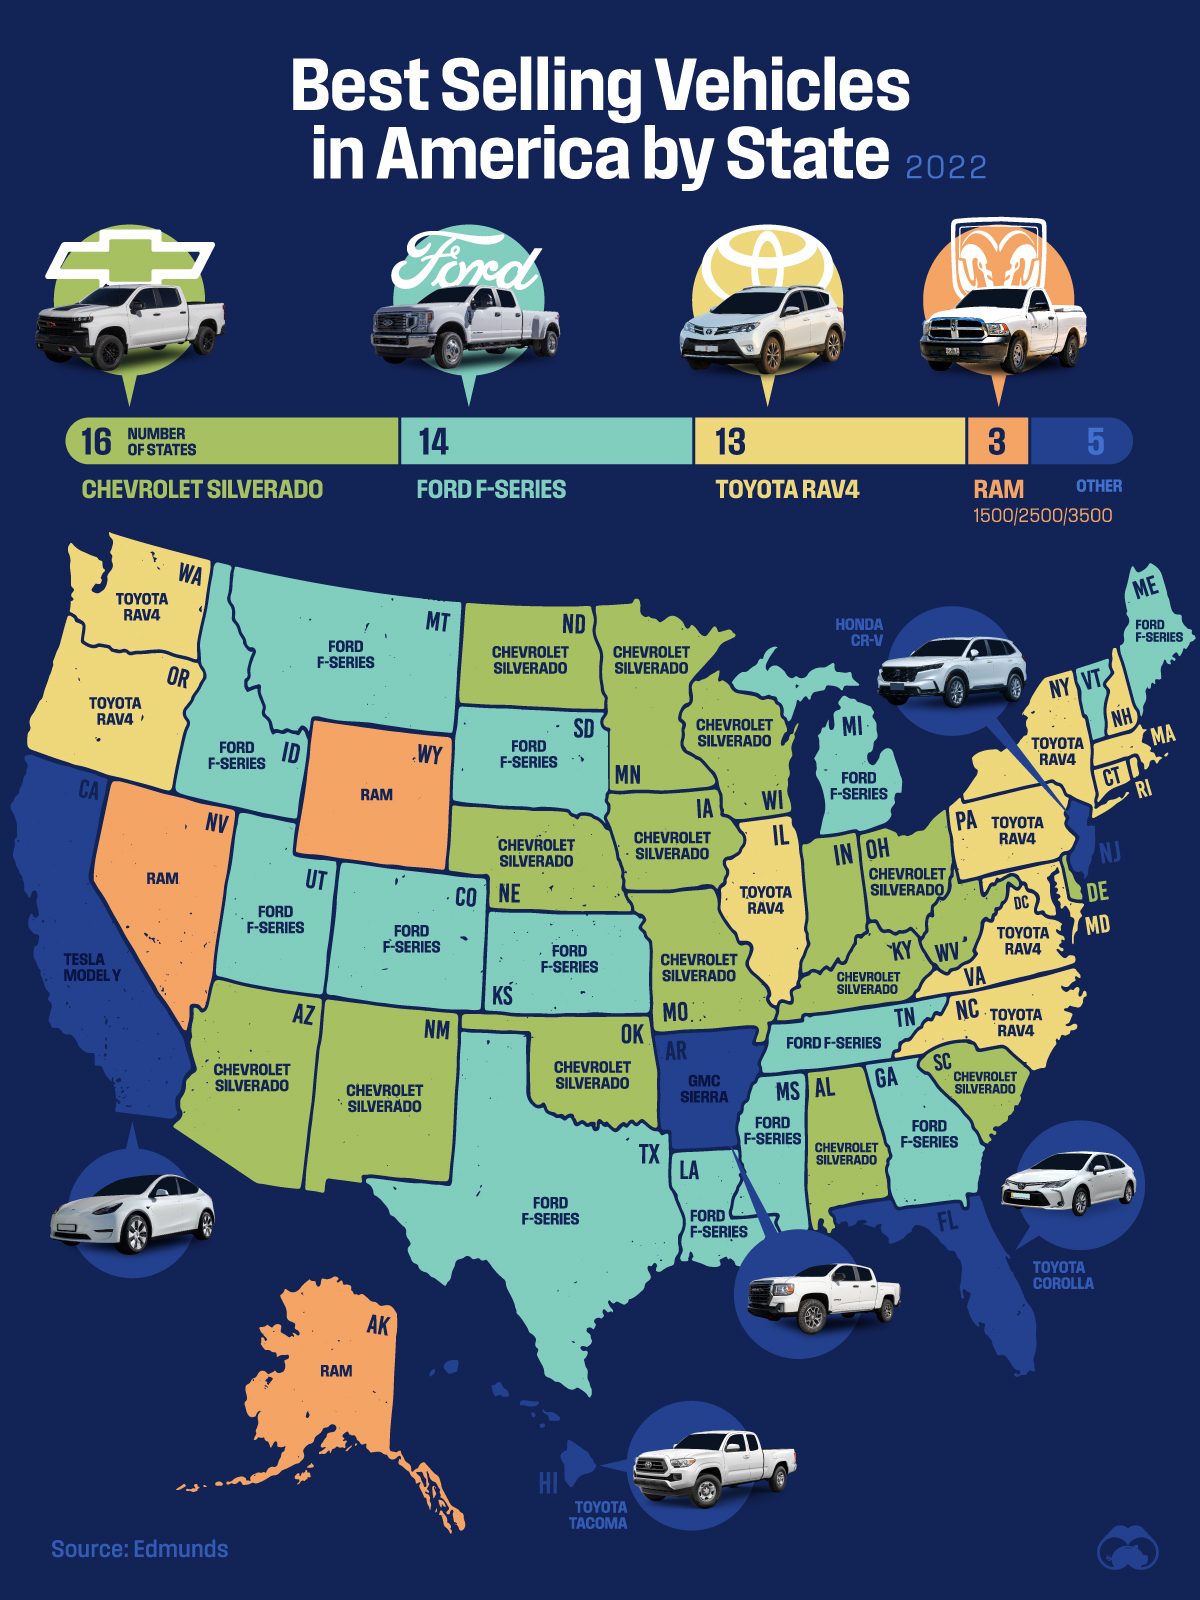
The Best Selling Vehicle in Every State (2022)
This map shows the best selling vehicle in every U.S. state for 2022, based on data from Edmunds.
The main takeaway from the visualization is that trucks and SUVs are the top selling vehicle in every state but one. See below for the data in tabular format.
| State | Best selling vehicle |
|---|---|
| North Dakota | Chevrolet Silverado |
| Minnesota | Chevrolet Silverado |
| Wisconsin | Chevrolet Silverado |
| Iowa | Chevrolet Silverado |
| Nebraska | Chevrolet Silverado |
| Missouri | Chevrolet Silverado |
| Oklahoma | Chevrolet Silverado |
| New Mexico | Chevrolet Silverado |
| Arizona | Chevrolet Silverado |
| Indiana | Chevrolet Silverado |
| Ohio | Chevrolet Silverado |
| Kentucky | Chevrolet Silverado |
| West Virginia | Chevrolet Silverado |
| Alabama | Chevrolet Silverado |
| Delaware | Chevrolet Silverado |
| South Carolina | Chevrolet Silverado |
| Montana | Ford F-Series |
| Idaho | Ford F-Series |
| Utah | Ford F-Series |
| Colorado | Ford F-Series |
| South Dakota | Ford F-Series |
| Kansas | Ford F-Series |
| Texas | Ford F-Series |
| Louisiana | Ford F-Series |
| Mississippi | Ford F-Series |
| Tennessee | Ford F-Series |
| Georgia | Ford F-Series |
| Michigan | Ford F-Series |
| Vermont | Ford F-Series |
| Maine | Ford F-Series |
| Washington | Toyota RAV4 |
| Oregon | Toyota RAV4 |
| Illinois | Toyota RAV4 |
| New York | Toyota RAV4 |
| Pennsylvania | Toyota RAV4 |
| Virginia | Toyota RAV4 |
| North Carolina | Toyota RAV4 |
| Maryland | Toyota RAV4 |
| Connecticut | Toyota RAV4 |
| Rhode Island | Toyota RAV4 |
| Massachusetts | Toyota RAV4 |
| DC | Toyota RAV4 |
| New Hampshire | Toyota RAV4 |
| Wyoming | RAM |
| Nevada | RAM |
| Alaska | RAM |
| New Jersey | Honda CR-V |
| Arkansas | GMC Sierra |
| Hawaii | Toyota Tacoma |
| California | Tesla Model Y |
| Florida | Toyota Corolla |
From this list, we can see that the only state where a sedan is the best selling vehicle is Florida. This is unsurprising, given that sedan popularity has been waning in the U.S. for quite some time. This is due to various factors, including shifting consumer preferences and the improved fuel efficiency of trucks and SUVs.
EVs Gain a Foothold
Another interesting story from this map can be found in California, which is the first and only state where an EV, specifically the Tesla Model Y, is the best selling vehicle.
California leads the nation in terms of EV adoption, and coincidentally also has the largest number of Tesla charging stations at 366 (As of July 2023). The next two states in terms of Tesla charging stations are Florida (136) and Texas (128).
Other states that could soon see an EV become their best selling vehicle include Washington and DC. In both these jurisdictions, the Model Y is currently the second most popular vehicle.


Misc
The Top 25 Nationalities of U.S. Immigrants
Mexico is the largest source of immigrants to the U.S., with almost 11 million immigrants.


The Top 25 Nationalities of U.S. Immigrants
This was originally posted on our Voronoi app. Download the app for free on iOS or Android and discover incredible data-driven charts from a variety of trusted sources.
The United States is home to more than 46 million immigrants, constituting approximately 14% of its total population.
This graphic displays the top 25 countries of origin for U.S. immigrants, based on 2022 estimates. The data is sourced from the Migration Policy Institute (MPI), which analyzed information from the U.S. Census Bureau’s 2022 American Community Survey.
In this context, “immigrants” refer to individuals residing in the United States who were not U.S. citizens at birth.
Mexico Emerges as a Leading Source of Immigration
Mexico stands out as the largest contributor to U.S. immigration due to its geographical proximity and historical ties.
Various economic factors, including wage disparities and employment opportunities, motivate many Mexicans to seek better prospects north of the border.
| Country | Region | # of Immigrants |
|---|---|---|
| 🇲🇽 Mexico | Latin America & Caribbean | 10,678,502 |
| 🇮🇳 India | Asia | 2,839,618 |
| 🇨🇳 China | Asia | 2,217,894 |
| 🇵🇭 Philippines | Asia | 1,982,333 |
| 🇸🇻 El Salvador | Latin America & Caribbean | 1,407,622 |
| 🇻🇳 Vietnam | Asia | 1,331,192 |
| 🇨🇺 Cuba | Latin America & Caribbean | 1,312,510 |
| 🇩🇴 Dominican Republic | Latin America & Caribbean | 1,279,900 |
| 🇬🇹 Guatemala | Latin America & Caribbean | 1,148,543 |
| 🇰🇷 Korea | Asia | 1,045,100 |
| 🇨🇴 Colombia | Latin America & Caribbean | 928,053 |
| 🇭🇳 Honduras | Latin America & Caribbean | 843,774 |
| 🇨🇦 Canada | Northern America | 821,322 |
| 🇯🇲 Jamaica | Latin America & Caribbean | 804,775 |
| 🇭🇹 Haiti | Latin America & Caribbean | 730,780 |
| 🇬🇧 United Kingdom | Europe | 676,652 |
| 🇻🇪 Venezuela | Latin America & Caribbean | 667,664 |
| 🇧🇷 Brazil | Latin America & Caribbean | 618,525 |
| 🇩🇪 Germany | Europe | 537,484 |
| 🇪🇨 Ecuador | Latin America & Caribbean | 518,287 |
| 🇵🇪 Peru | Latin America & Caribbean | 471,988 |
| 🇳🇬 Nigeria | Africa | 448,405 |
| 🇺🇦 Ukraine | Europe | 427,163 |
| 🇮🇷 Iran | Middle East | 407,283 |
| 🇵🇰 Pakistan | Asia | 399,086 |
| Rest of World | 11,637,634 | |
| Total | 46,182,089 |
Mexicans are followed in this ranking by Indians, Chinese, and Filipinos, though most immigrants on this list come from countries in the Latin American and Caribbean region.
On the other hand, only three European countries are among the top sources of U.S. immigrants: the UK, Germany, and Ukraine.
Immigration continues to be a significant factor contributing to the overall growth of the U.S. population. Overall population growth has decelerated over the past decade primarily due to declining birth rates.
Between 2021 and 2022, the increase in the immigrant population accounted for 65% of the total population growth in the U.S., representing 912,000 individuals out of nearly 1.4 million.
If you enjoyed this post, be sure to check out Visualized: Why Do People Immigrate to the U.S.? This visualization shows the different reasons cited by new arrivals to America in 2021.

-

 Personal Finance1 week ago
Visualizing the Tax Burden of Every U.S. State
-

 Misc6 days ago
Visualized: Aircraft Carriers by Country
-

 Culture6 days ago
How Popular Snack Brand Logos Have Changed
-

 Mining1 week ago
Visualizing Copper Production by Country in 2023
-

 Misc1 week ago
Charted: How Americans Feel About Federal Government Agencies
-

 Healthcare1 week ago
Which Countries Have the Highest Infant Mortality Rates?
-

 Demographics1 week ago
Mapped: U.S. Immigrants by Region
-

 Maps1 week ago
Mapped: Southeast Asia’s GDP Per Capita, by Country