Business
The 20 Most and Least Profitable Companies, Per Employee


The 20 Most and Least Profitable Companies, Per Employee
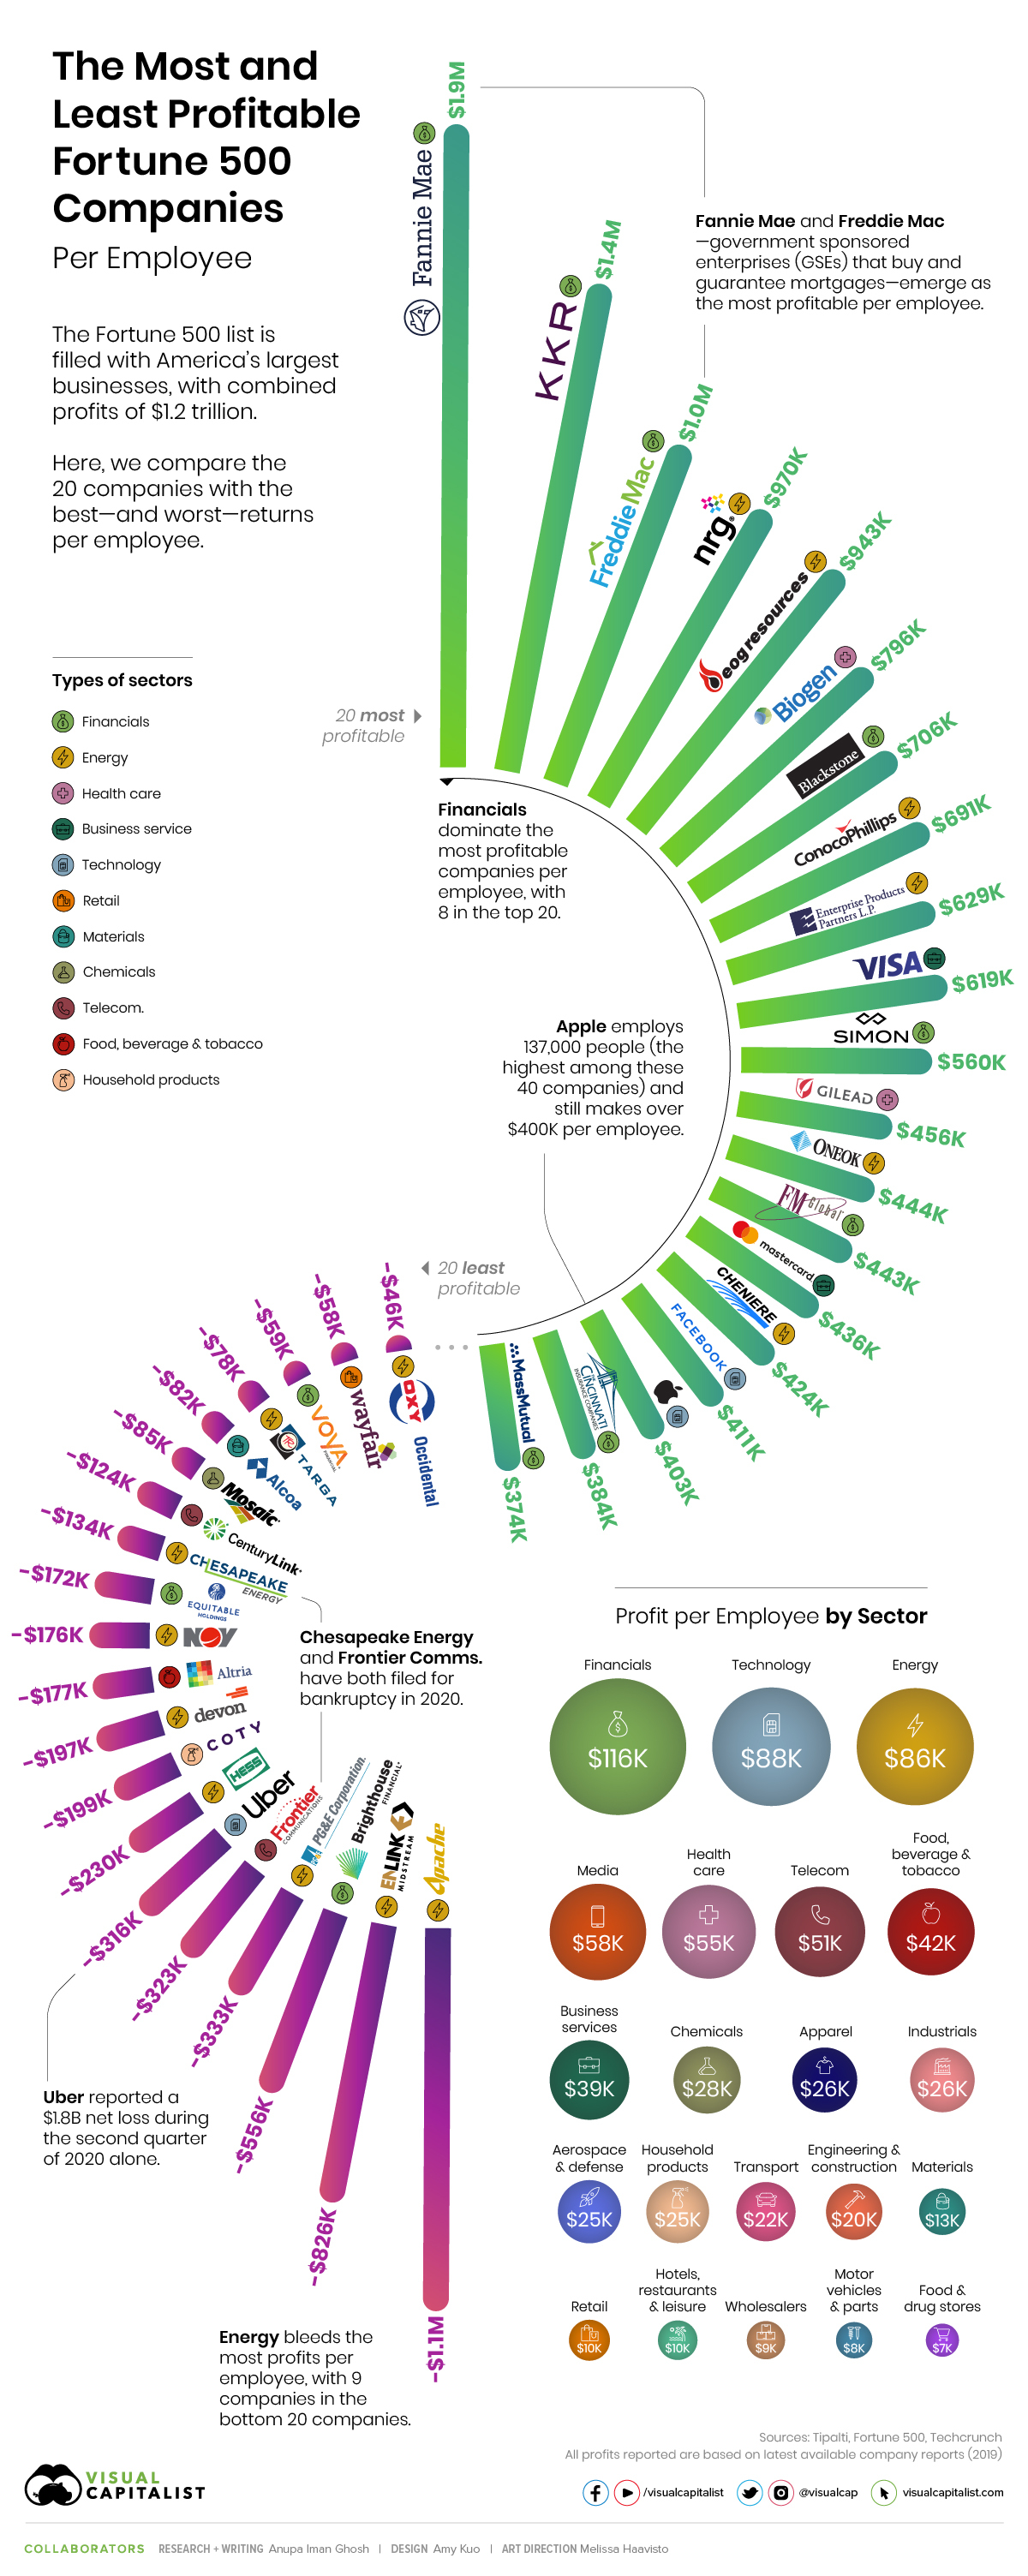
The Fortune 500 is an elite club of the biggest American businesses, which combined to generate profits of over $1.2 trillion in 2019.
But how much profit do these companies make on a per employee basis?
This visualization uncovers the answer by comparing the 20 companies with the most and least returns per employee, using calculations from Tipalti (based on the Fortune 500 list).
Top 20: Most Profit per Employee
Diving right in, the companies that make the most money per employee may surprise you.
Housing giants Fannie Mae and Freddie Mac take two of the top three spots, bringing in $1.9 million and $1.0 million per employee respectively in 2019.
The two U.S. government sponsored enterprises (GSEs) are major players in the secondary mortgage market, buying and repackaging nearly half the mortgages in the country. The duo was allowed to retain their profits as of October 2019, instead of returning them to the U.S. Treasury.
| Company | Sector | Profit per Employee | Profits ($M) | Employees |
|---|---|---|---|---|
| Fannie Mae (Federal National Mortgage Association) | Financials | $1,888,000 | $14,160 | 7,500 |
| KKR | Financials | $1,448,699 | $2,005 | 1,384 |
| Freddie Mac (Federal Home Loan Mortgage Corporation) | Financials | $1,046,721 | $7,214 | 6,892 |
| NRG Energy | Energy | $969,631 | $4,438 | 4,577 |
| EOG Resources | Energy | $943,103 | $2,735 | 2,900 |
| Biogen | Health Care | $795,811 | $5,889 | 7,400 |
| Blackstone Group | Financials | $705,680 | $2,050 | 2,905 |
| ConocoPhillips | Energy | $691,250 | $7,189 | 10,400 |
| Enterprise Products Partners | Energy | $628,904 | $4,591 | 7,300 |
| Visa | Business Services | $619,487 | $12,080 | 19,500 |
| Simon Property Group | Financials | $560,533 | $2,102 | 3,750 |
| Gilead Sciences | Health Care | $456,441 | $5,386 | 11,800 |
| Oneok | Energy | $443,789 | $1,279 | 2,882 |
| FM Global | Financials | $443,391 | $2,479 | 5,591 |
| Mastercard | Business Services | $436,452 | $8,118 | 18,600 |
| Cheniere Energy | Energy | $423,529 | $648 | 1,530 |
| Technology | $411,308 | $18,485 | 44,942 | |
| Apple | Technology | $403,328 | $55,256 | 137,000 |
| Cincinnati Financial | Financials | $384,038 | $1,997 | 5,200 |
| Massachusetts Mutual Life Insurance | Financials | $373,989 | $3,701 | 9,896 |
Apple employs 137,000 people—the largest workforce by far among the 40 companies profiled—but still makes $403,328 per employee. Facebook is the only other tech giant to bring in more money per employee at $411,308.
Bottom 20: Least Profit per Employee
On the other end of the spectrum, Uber is one of the most well-known companies currently bleeding profits, losing $316K per employee. In fact, the ride-hailing service lost approximately $1.8 billion in the second quarter of 2020 alone.
| Company | Sector | Profit per Employee | Profits ($M) | Employees |
|---|---|---|---|---|
| Apache | Energy | -$1,123,301 | -$3,553 | 3,163 |
| EnLink Midstream | Energy | -$825,830 | -$1,119 | 1,355 |
| Brighthouse Financial | Financials | -$556,391 | -$740 | 1,330 |
| PG&E | Energy | -$332,870 | -$7,656 | 23,000 |
| Frontier Communications | Telecommunications | -$322,706 | -$5,911 | 18,317 |
| Uber Technologies | Technology | -$316,208 | -$8,506 | 26,900 |
| Hess | Energy | -$229,859 | -$408 | 1,775 |
| Coty | Household Products | -$199,158 | -$3,784 | 19,000 |
| Devon Energy | Energy | -$197,222 | -$355 | 1,800 |
| Altria Group | Food, Beverages & Tobacco | -$177,123 | -$1,293 | 7,300 |
| National Oilwell Varco | Energy | -$175,927 | -$6,095 | 34,645 |
| Equitable Holdings | Financials | -$171,584 | -$1,733 | 10,100 |
| Chesapeake Energy | Energy | -$133,913 | -$308 | 2,300 |
| CenturyLink | Telecommunications | -$123,976 | -$5,269 | 42,500 |
| Mosaic | Chemicals | -$84,683 | -$1,067 | 12,600 |
| Alcoa | Materials | -$81,522 | -$1,125 | 13,800 |
| Targa Resources | Energy | -$77,985 | -$209 | 2,680 |
| Voya Financial | Financials | -$58,500 | -$351 | 6,000 |
| Wayfair | Retailing | -$57,992 | -$985 | 16,985 |
| Occidental Petroleum | Energy | -$46,319 | -$667 | 14,400 |
COVID-19 has also had an intense effect on some of the companies at the bottom end of the profit per employee spectrum. Chesapeake Energy and Frontier Communications are just two examples that have filed for Chapter 11 bankruptcy in recent months—they each lost $134K and $322K per employee in 2019 respectively.
I’m pretty confident we will see more bankruptcies than in any business person’s lifetime.
—James Hammond, CEO of BankruptcyData
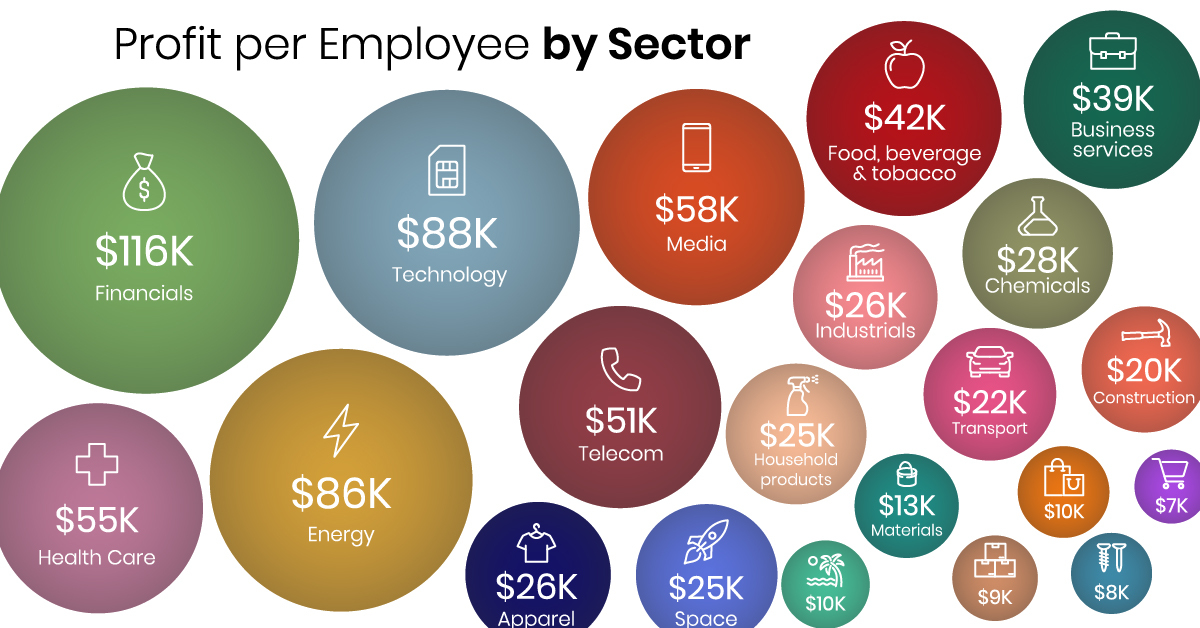
Profit per Employee by Sector
When all the companies in the Fortune 500 are taken into account, sector-specific numbers reveal interesting trends.
Financials bring in the most profit per employee at $116K, while Food and Drug Stores see 17 times less profit at $6.7K per employee. In fact, eight out of the top 20 most profitable companies are found in the financial sector.
| Sector | Profits per Employee | Profits ($M) | Employees |
|---|---|---|---|
| Financials | $116,228 | $378,445 | 3,256,067 |
| Technology | $87,532 | $252,836 | 2,888,490 |
| Energy | $85,547 | $75,410 | 881,505 |
| Media | $57,947 | $21,634 | 373,333 |
| Health Care | $54,679 | $145,166 | 2,654,872 |
| Telecommunications | $50,636 | $38,251 | 755,417 |
| F&B incl. Tobacco | $41,946 | $42,924 | 1,023,317 |
| Business Services | $39,354 | $36,835 | 936,000 |
| Chemicals | $27,977 | $11,328 | 404,888 |
| Apparel | $26,154 | $7,776 | 297,300 |
| Industrials | $25,827 | $27,006 | 1,045,675 |
| Aerospace & Defence | $24,793 | $23,903 | 964,100 |
| Household Products | $24,504 | $10,415 | 425,038 |
| Transportation | $21,762 | $32,454 | 1,491,358 |
| Engineering & Construction | $19,648 | $6,773 | 344,716 |
| Materials | $13,408 | $6,024 | 449,252 |
| Retailing | $10,373 | $67,318 | 6,489,923 |
| Hotels, Restaurants & Leisure | $9,653 | $16,880 | 1,748,714 |
| Wholesalers | $9,025 | $5,842 | 647,312 |
| Motor Vehicles & Parts | $8,113 | $7,108 | 876,123 |
| Food & Drug Stores | $6,746 | $8,355 | 1,238,645 |
Interestingly, as a whole, the energy sector comes in third place in terms of profit per employee at $86K—that said, nine out of the bottom 20 least profitable companies are also found in this highly volatile industry.
Though the vast majority of businesses impacted by COVID-19 have been small to mid-sized companies, the above calculations also show that Fortune 500 companies are not safe, either.


Finance
Ranked: The World’s 50 Largest Private Equity Firms
In this graphic, we show the largest private equity firms in the world—from titan Blackstone to China’s leading alternative funds.
The World’s 50 Largest Private Equity Firms
This was originally posted on our Voronoi app. Download the app for free on iOS or Android and discover incredible data-driven charts from a variety of trusted sources.
In 2023, private equity firms controlled $8.2 trillion in assets globally according to McKinsey & Company, a figure that has rapidly expanded since the industry first emerged 40 years ago.
As large investors such as pension funds and insurance companies increasingly look to private markets, these alternative asset managers have seen their assets grow by more than twofold in the last five years.
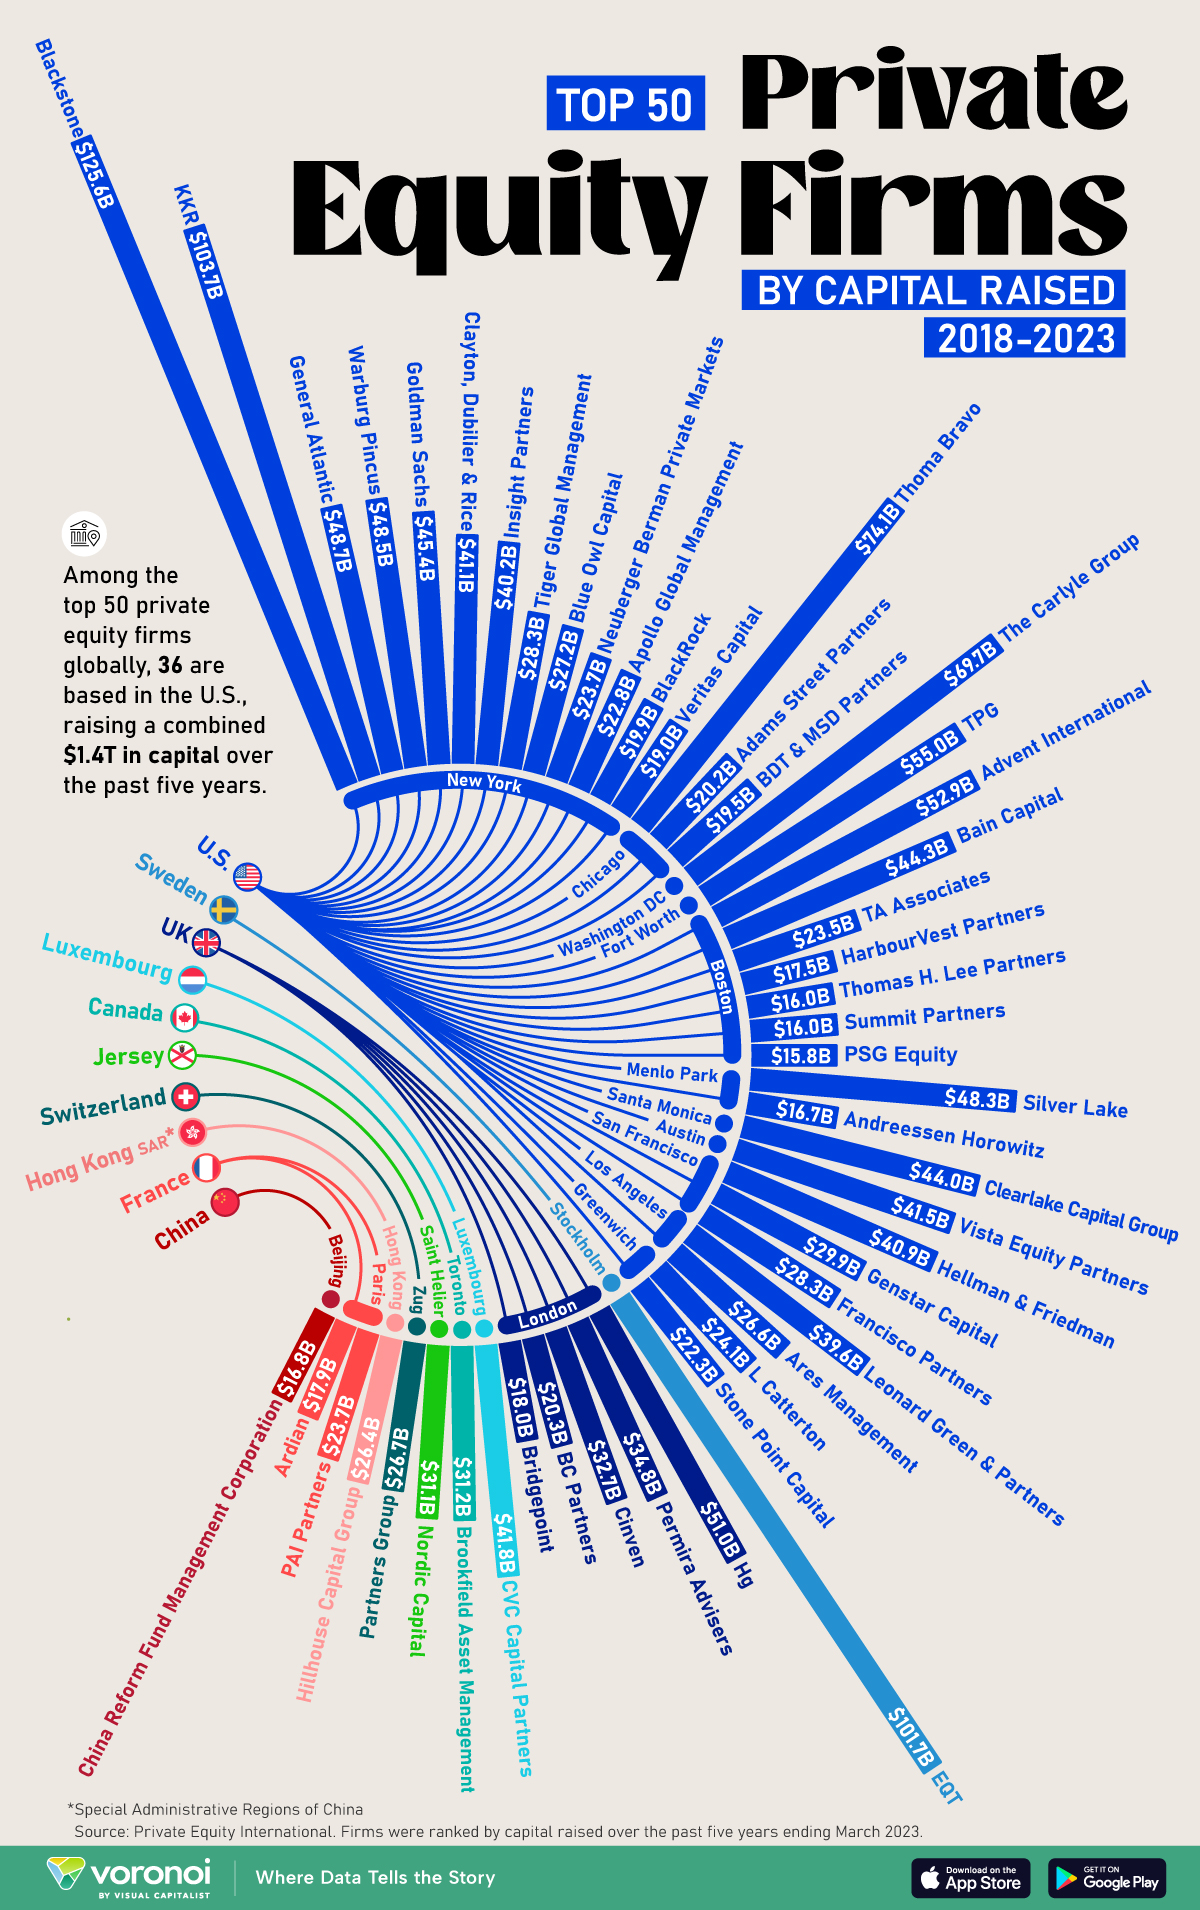
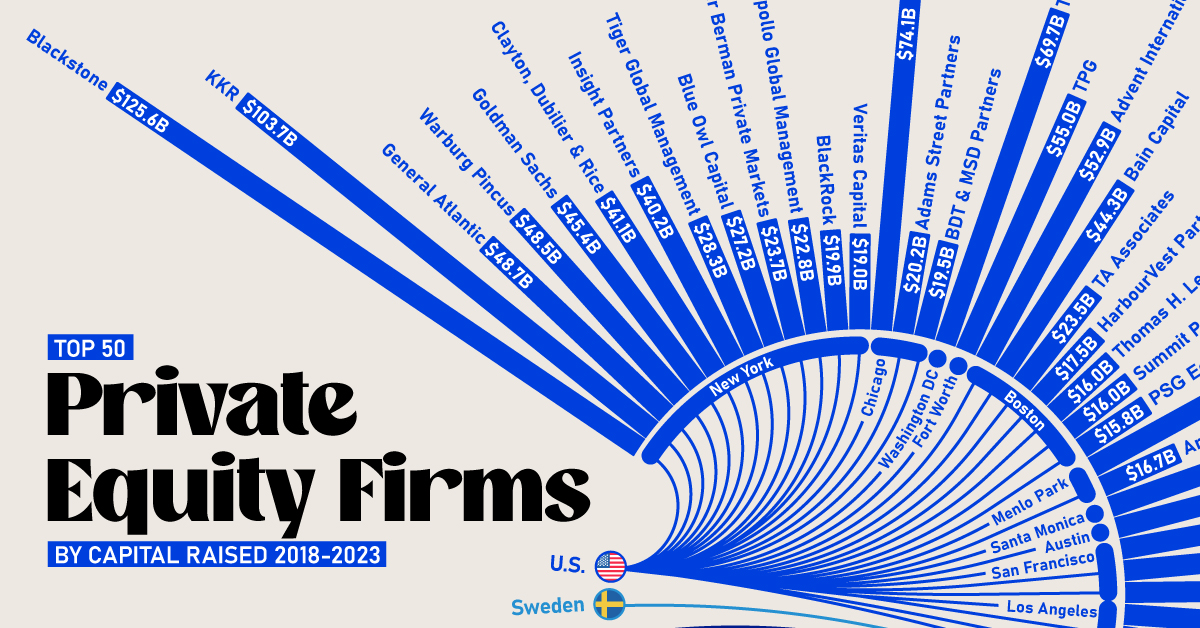
This graphic shows the top 50 private equity firms worldwide, based on data from Private Equity International (PEI).
The Top 50 Private Equity Firms
To determine the rankings, private equity firms were defined as those that raise capital with the purpose of directly investing in businesses, covering diversified private equity, venture capital, growth equity, buyouts, along with turnaround or control-oriented distressed investment capital.
The ranking does not include funds of funds, private investment in public equity (PIPE), or funds that follow a secondaries, real estate, infrastructure, hedge fund, debt or mezzanine strategies.
Below, we show the 50 biggest private equity companies around the world, measured by the scale of capital raised over the five-year period ending March 31, 2023:
| Ranking | Fund Manager | City | Capital Raised |
|---|---|---|---|
| 1 | Blackstone | New York | $125.6B |
| 2 | KKR | New York | $103.7B |
| 3 | EQT | Stockholm | $101.7B |
| 4 | Thoma Bravo | Chicago | $74.1B |
| 5 | The Carlyle Group | Washington DC | $69.7B |
| 6 | TPG | Fort Worth | $55.0B |
| 7 | Advent International | Boston | $52.9B |
| 8 | Hg | London | $51.0B |
| 9 | General Atlantic | New York | $48.7B |
| 10 | Warburg Pincus | New York | $48.5B |
| 11 | Silver Lake | Menlo Park | $48.3B |
| 12 | Goldman Sachs | New York | $45.4B |
| 13 | Bain Capital | Boston | $44.3B |
| 14 | Clearlake Capital Group | Santa Monica | $44.0B |
| 15 | CVC Capital Partners | Luxembourg | $41.8B |
| 16 | Vista Equity Partners | Austin | $41.5B |
| 17 | Clayton, Dubilier & Rice | New York | $41.1B |
| 18 | Hellman & Friedman | San Francisco | $40.9B |
| 19 | Insight Partners | New York | $40.2B |
| 20 | Leonard Green & Partners | Los Angeles | $39.6B |
| 21 | Permira Advisers | London | $34.8B |
| 22 | Cinven | London | $32.7B |
| 23 | Brookfield Asset Management | Toronto | $31.2B |
| 24 | Nordic Capital | Saint Helier | $31.1B |
| 25 | Genstar Capital | San Francisco | $29.9B |
| 26 | Francisco Partners | San Francisco | $28.3B |
| 27 | Tiger Global Management | New York | $28.3B |
| 28 | Blue Owl Capital | New York | $27.2B |
| 29 | Partners Group | Zug | $26.7B |
| 30 | Ares Management | Los Angeles | $26.6B |
| 31 | Hillhouse Capital Group | Singapore | $26.4B |
| 32 | L Catterton | Greenwich | $24.1B |
| 33 | Neuberger Berman Private Markets | New York | $23.7B |
| 34 | PAI Partners | Paris | $23.7B |
| 35 | TA Associates | Boston | $23.5B |
| 36 | Apollo Global Management | New York | $22.8B |
| 37 | Stone Point Capital | Greenwich | $22.3B |
| 38 | BC Partners | London | $20.3B |
| 39 | Adams Street Partners | Chicago | $20.2B |
| 40 | BlackRock | New York | $19.9B |
| 41 | BDT & MSD Partners | Chicago | $19.5B |
| 42 | Veritas Capital | New York | $19.0B |
| 43 | Bridgepoint | London | $18.0B |
| 44 | Ardian | Paris | $17.9B |
| 45 | HarbourVest Partners | Boston | $17.5B |
| 46 | China Reform Fund Management Corporation | Beijing | $16.8B |
| 47 | Andreessen Horowitz | Menlo Park | $16.7B |
| 48 | Thomas H. Lee Partners | Boston | $16.0B |
| 49 | Summit Partners | Boston | $16.0B |
| 50 | PSG Equity | Boston | $15.8B |
Private equity titan Blackstone is the top in the United States and the world, raising $125.6 billion in capital from 2018 to 2023.
Headquartered in New York, Blackstone’s total assets under management stood at $991 billion as of the first quarter of 2023, and have since surpassed $1 trillion this year. For perspective, this is comparable to the GDP of the Netherlands.
Following next in line are KKR and Sweden’s EQT, each raising over $100 billion. In fact, this was the first time three firms achieved this $100 billion equity-raise milestone in PEI’s ranking over a five-year period. This was particularly notable given a challenging fundraising landscape amid higher borrowing costs and lagging dealmaking activity.
North American Firms Dominate Private Equity
As we can see, the vast majority of the biggest private equity firms are based in America, accounting for 36 of the top 50 firms globally. North American PE firms made up $1.34 trillion (72%) of the $1.85 trillion raised by the top 50 firms in the ranking.
Falling in second by a wide margin is Europe, with nine firms making up $179 billion (9.7%) of the total funds raised. Many of Europe’s largest private equity firms are based in London, England, with the most prominent asset managers in the city being Hg and Permira Advisors.
Across Asia, the top alternative investment firm was Singapore-based Hillhouse Capital Group, which launched in 2005. The firm has backed several internet companies spanning from Tencent, the largest publicly-traded company in China, to Baidu, but has faced increasing setbacks amid regulatory crackdowns and a sluggish Chinese stock market.

-

 Personal Finance1 week ago
Visualizing the Tax Burden of Every U.S. State
-

 Misc6 days ago
Visualized: Aircraft Carriers by Country
-

 Culture6 days ago
How Popular Snack Brand Logos Have Changed
-

 Mining1 week ago
Visualizing Copper Production by Country in 2023
-

 Misc1 week ago
Charted: How Americans Feel About Federal Government Agencies
-

 Healthcare1 week ago
Which Countries Have the Highest Infant Mortality Rates?
-

 Demographics1 week ago
Mapped: U.S. Immigrants by Region
-

 Maps1 week ago
Mapped: Southeast Asia’s GDP Per Capita, by Country