Mapped: The 10 U.S. States With the Lowest Real GDP Growth
Ranked: The World’s 50 Largest Private Equity Firms
Top 10 Countries Most in Debt to the IMF
Ranked: The Top 6 Economies by Share of Global GDP (1980-2024)
Mapped: Europe’s GDP Per Capita, by Country
Countries With the Highest Rates of Crypto Ownership
Mapped: The Number of AI Startups By Country
All of the Grants Given by the U.S. CHIPS Act
Visualizing AI Patents by Country
How Tech Logos Have Evolved Over Time
Visualizing America’s Average Retirement Savings, by Age
Visualizing the Tax Burden of Every U.S. State
Charted: What Frustrates Americans About the Tax System
Ranked: The Top 20 Countries in Debt to China
Mapped: Countries Where Recreational Cannabis is Legal
Which Countries Have the Highest Infant Mortality Rates?
Life Expectancy by Region (1950-2050F)
What Causes Preventable Child Deaths?
The Cost of an EpiPen in Major Markets
Who’s Building the Most Solar Energy?
Mapped: The Age of Energy Projects in Interconnection Queues, by State
Ranked: The Top 10 EV Battery Manufacturers in 2023
The World’s Biggest Nuclear Energy Producers
The World’s Biggest Oil Producers in 2023
Mapped: The Top Exports in Asian Countries
Mapped: U.S. States By Number of Cities Over 250,000 Residents
Mapped: U.S. Immigrants by Region
The Biggest Salt Producing Countries in 2023
Visualizing Copper Production by Country in 2023
Where the World’s Aluminum is Smelted, by Country
Visualizing Global Gold Production in 2023
How People Get Around in America, Europe, and Asia
The Carbon Footprint of Major Travel Methods
Ranking the Top 15 Countries by Carbon Tax Revenue
Ranked: The Countries With the Most Air Pollution in 2023
Top Countries By Forest Growth Since 2001
Have you ever wondered how much copper is in an electric vehicle? This infographic shows the metal's properties as well as the quantity of copper used.
Need to get something for the person who has everything, or the client who just loves jaw-dropping data? See why the Visual Capitalist book may be...
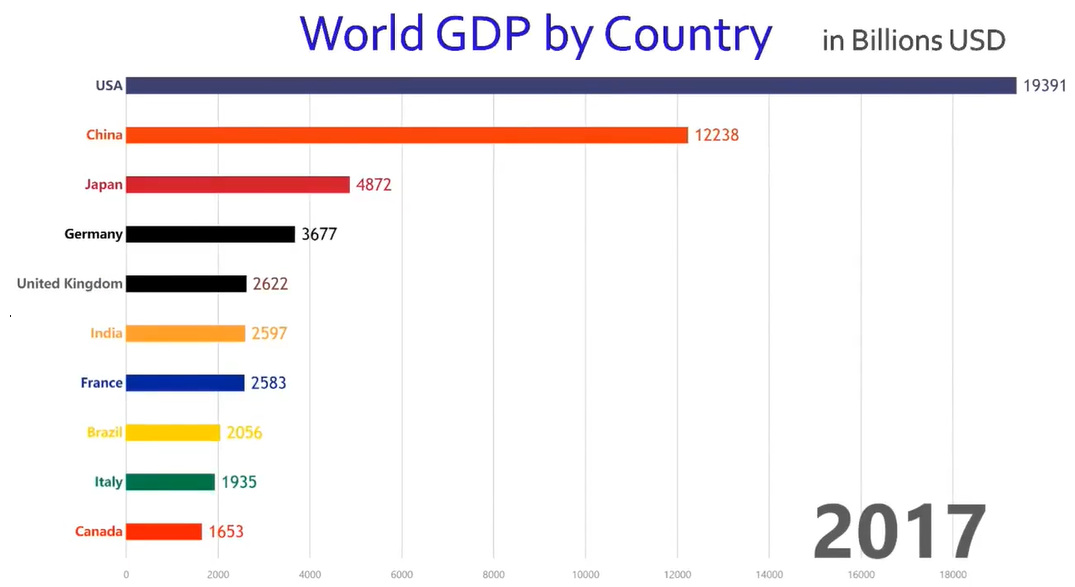
This rapid-paced animation shows year-by-year changes in GDP for the world's 10 largest economies over the course of 57 years.
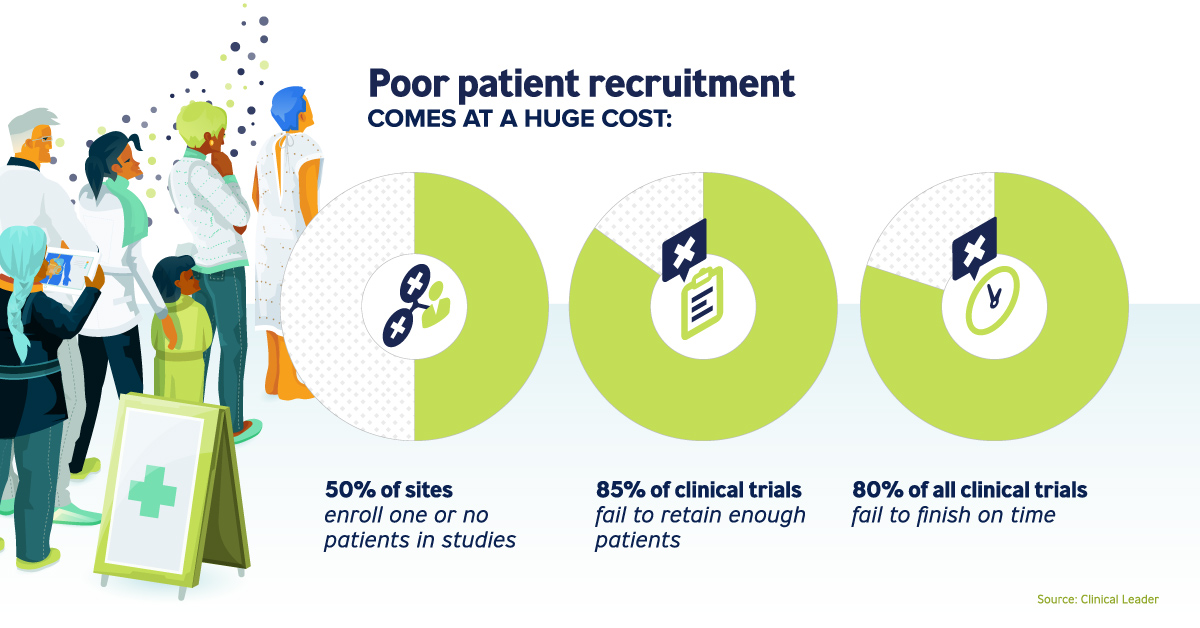
Poor clinical trial recruitment can cause losses up to $8 million each day. How can health and pharma companies get better at finding the right patients?
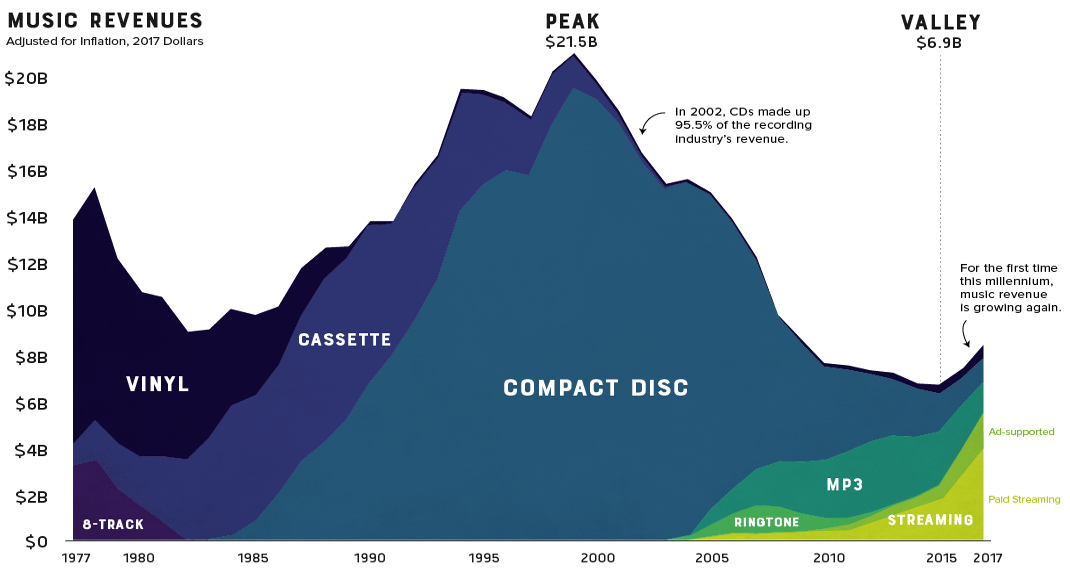
A revealing look at three decades of music industry sales. After a devastating decline, streaming services like Spotify are helping the industry regain its footing.
Our brain can be our own worst enemy. It's hardwired to avoid pain, and to seek pleasure - and these instincts can wreak havoc on your...
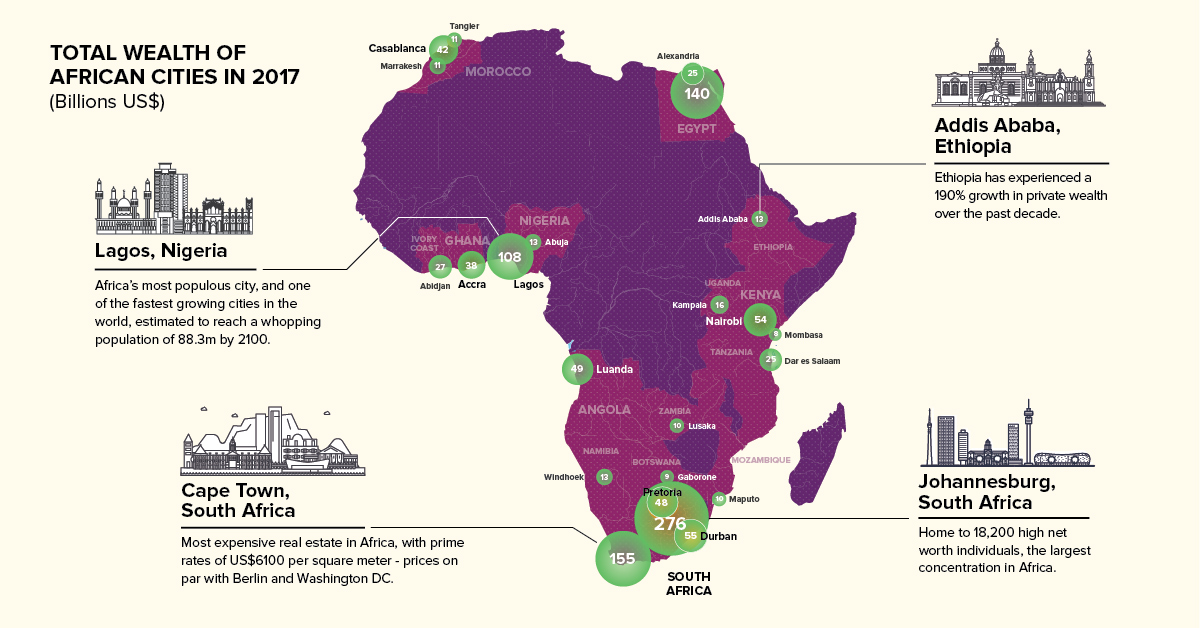
Private wealth in Africa is set to grow $800 billion in the next decade. Here are the continent's 23 richest cities mapped, along with other key...
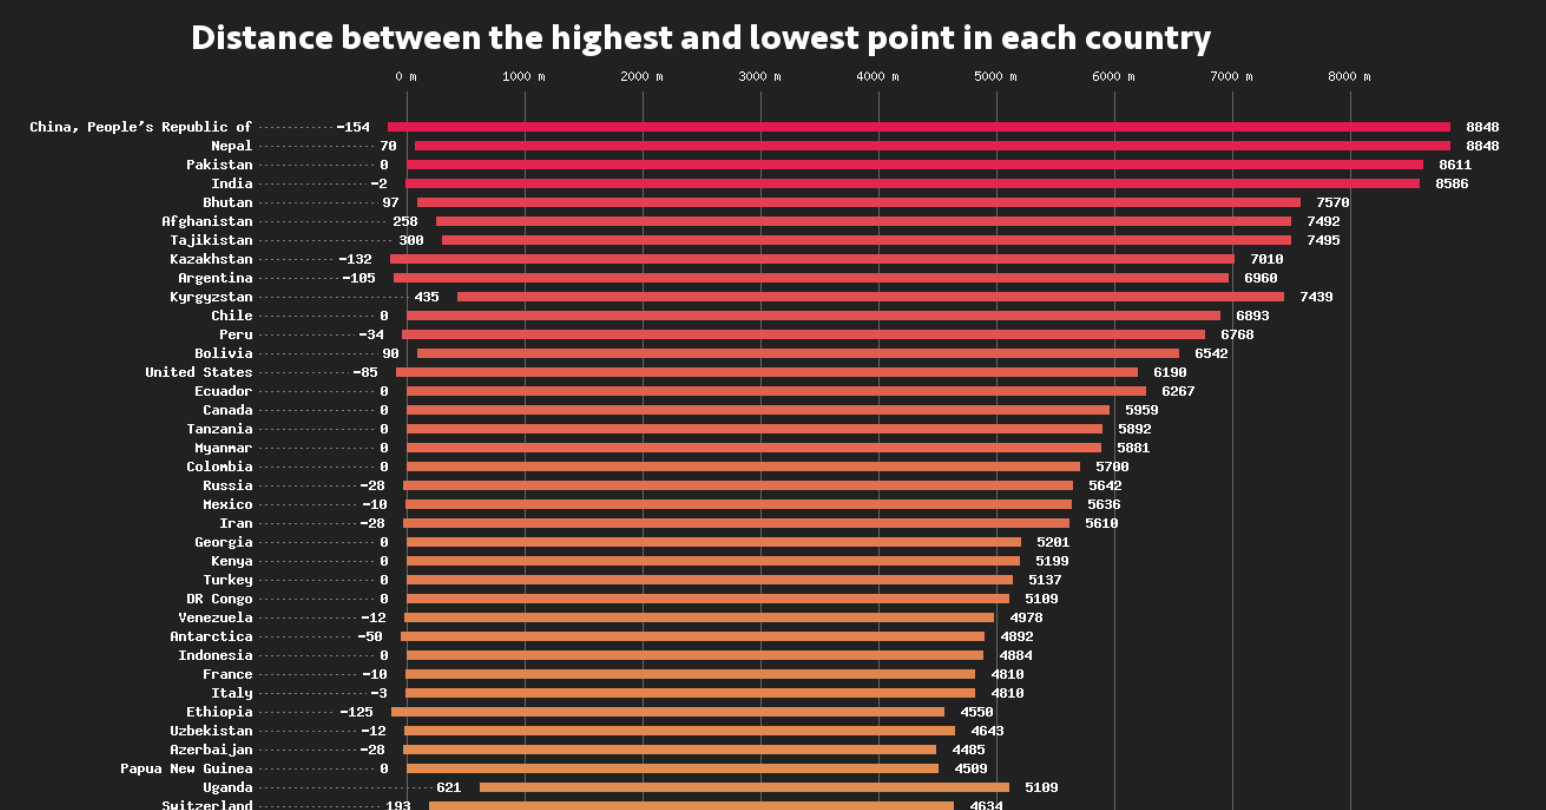
This data visualization compares the elevation span of every country, ranging from the mountain peaks of Bhutan, to the Dead Sea depression.
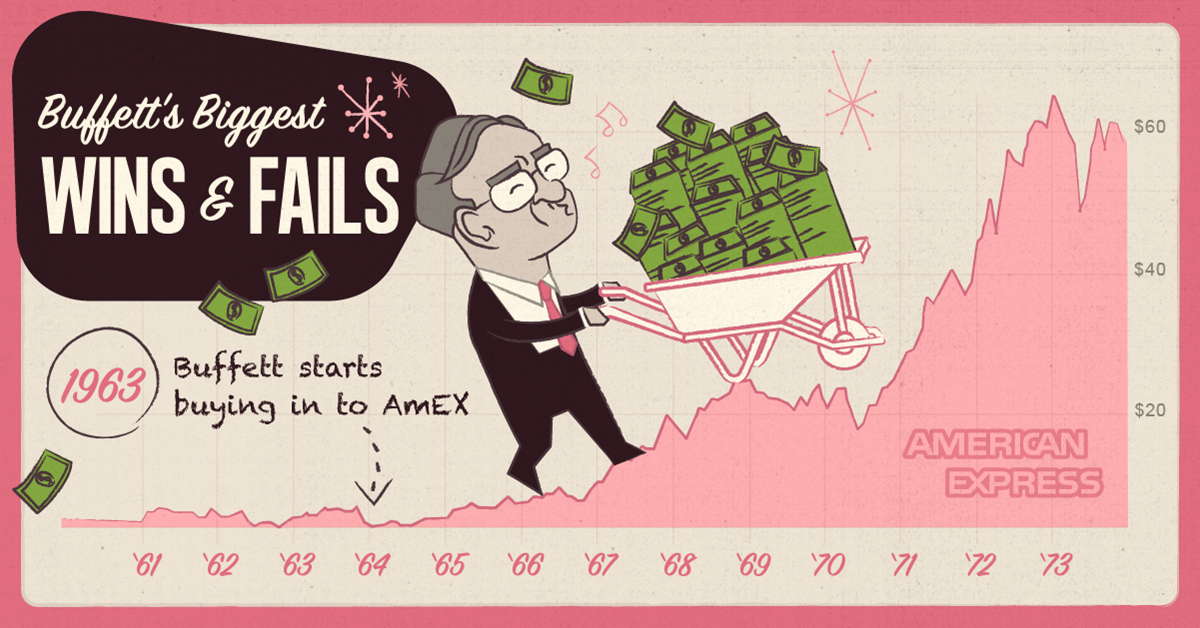
Counting down Warren Buffett's biggest wins and fails, including a mistake that the iconic investor estimates has costed him $200 billion to date.
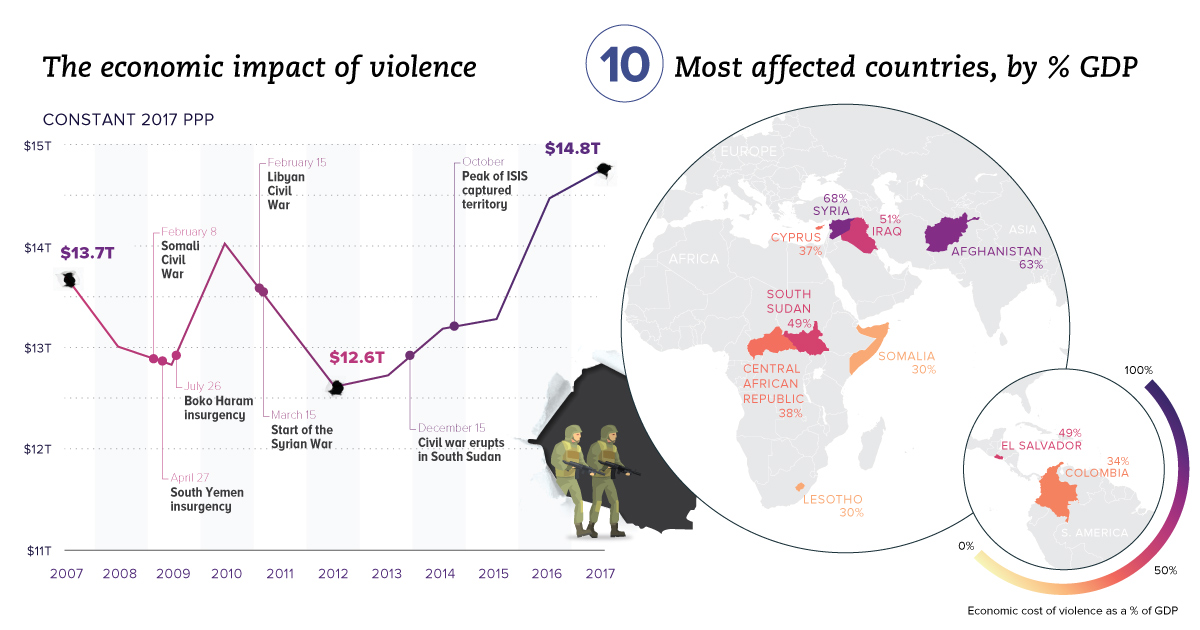
Aside from the obvious human toll, violence also hurts productivity and wealth creation. We visualize the real economic impact of violence in these charts.