Visual Capitalist
7 Reasons Our Book is the Perfect Holiday Gift
Did you know, 9 in 10 people leave their holiday shopping to the last minute?
Finding a meaningful gift for the “person who has everything” is never an easy task. But have no fear, VC is here.
Below are 7 reasons why our new coffee table book is the perfect gift for anyone with a curiosity streak – and why you should get them a copy right away.

For one- or two-day shipping, buy with ![]()
Also available on Amazon.ca
1. The book is a great conversation starter
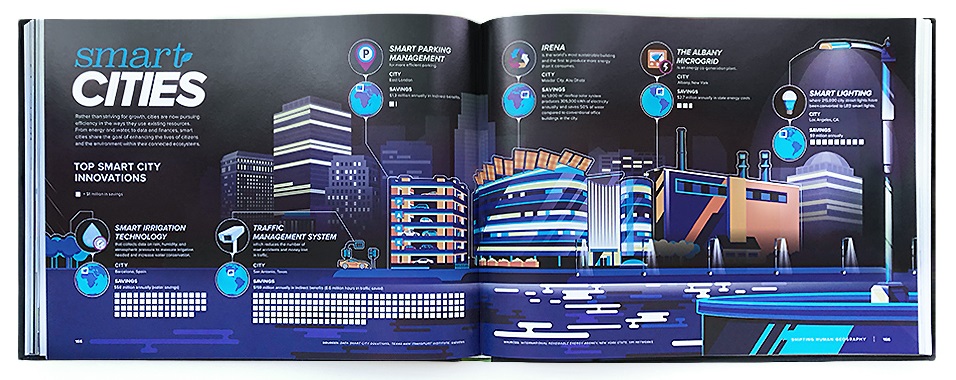
What does artificial intelligence have to do with the rapid urbanization of emerging markets?
Both topics (and more) are found in Visualizing Change – and they’ll help inject some life into the next family holiday dinner.
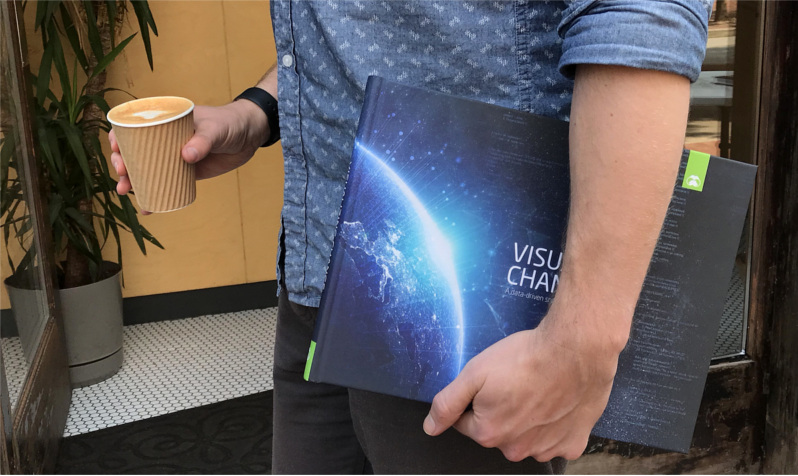
2. Get it for the person who has everything
We all know that one person who is impossible to buy for.
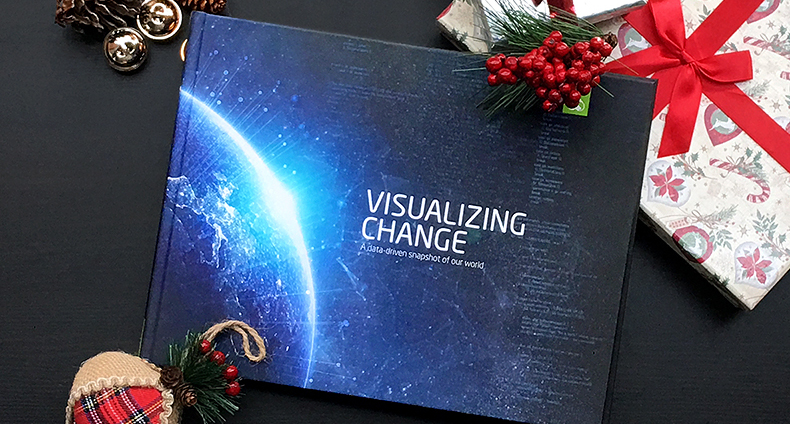
The great thing about Visualizing Change is that it’s completely unique. The book is 100% visual in nature, filled with 256 pages of infographics, charts, and maps.
We promise that it’s absolutely a one-of-a-kind gift. So order today to cross off your holiday shopping gift list!
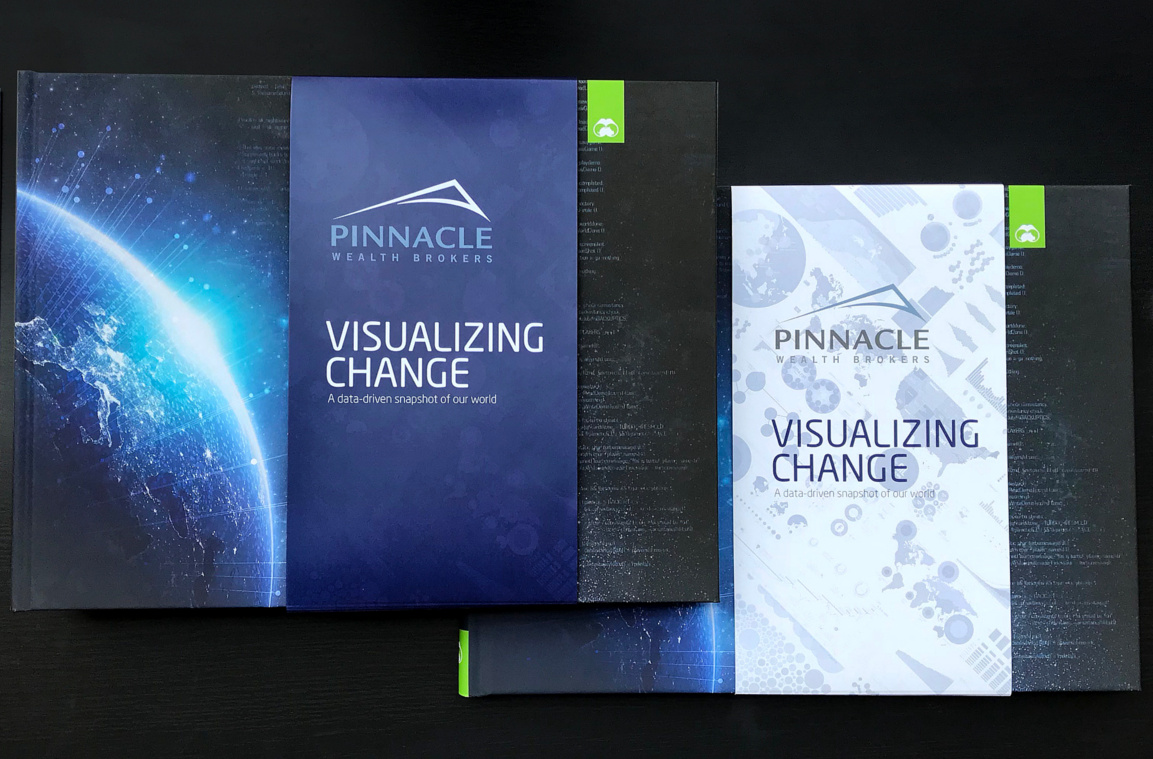
3. Your clients will love it, too
This year, give your clients the gift of knowledge. Our signature data-driven visuals make the book an ideal corporate gift, and companies have taken advantage of our customized bulk orders.
In a hurry? North American companies can skip the customization and have bulk orders on their doorstep within 48 hours using Amazon Prime.
The books are a beautifully appointed gift for our top clients.
 The deadline to receive custom orders before Christmas has passed, but non-holiday orders can still be fulfilled!
4. The book is full of jaw-dropping data
- What will the world’s most populous cities be in 80 years?
- Which governments owe trillions of dollars in debt?
- How much money exists?
- How many Chinese cities have over 1 million inhabitants?
- How did the world’s richest billionaires make their fortunes?
In the book, you’ll find the answers to these questions and more.
See an in-depth preview of major themes in the book.

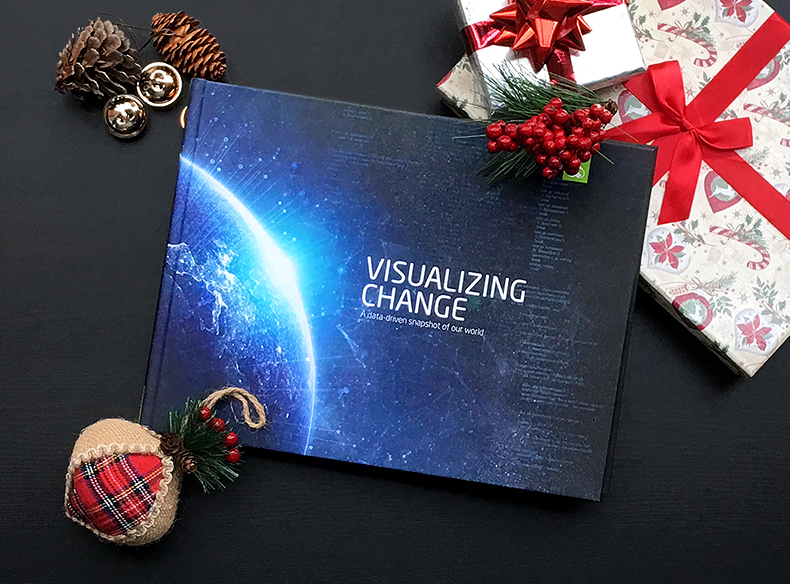
5. It looks fantastic on your coffee table
We’d be embarrassed if our book ended up looking tacky in your living room.
That’s why we put extra care into selecting the book materials: a strong hardcover and high-quality paper that allows the art to pop.
6. 5-Star ratings on Amazon
We are proud to say that our book has almost exclusively 5-star reviews from customers on Amazon.
If you’re still not convinced, we encourage you to read existing customer reviews on the impact of this data-focused work of art.
Buying a bunch to hand out as gifts, it’s that good!
This book visualizes the key economic facts and drivers of our times… I retain about 400% more key data looking at their graphs.
– Amazon review
7. There is a limited supply of books left
We expect to sell out of individual books and our bulk order inventory by Christmas time.
Get Visualizing Change as the perfect gift now – and don’t risk missing out!
For one- or two-day shipping, buy with ![]()
Also available on Amazon.ca
Best of
Best Visualizations of March on the Voronoi App
We round up the most popular, most discussed, and most liked visualizations of the month on Voronoi, our new data storytelling platform.
At the end of 2023, we publicly launched Voronoi, our free new data discovery app!
The initial response from both users and creators has been incredible. We now have millions of in-app views, and there are already more than 700 interesting visualizations to discover, many of which will never be published on Visual Capitalist.
For that reason, we’ve chosen to highlight some of the most popular visualizations and creators from March in this roundup. To see them and many others, make sure to download the app!
Let’s take a look at a popular creator worth highlighting, as well as the most viewed, most discussed, and most liked posts of the month.
POPULAR CREATOR
Ehsan Soltani
Visual Capitalist isn’t the only creator on the Voronoi app.
Instead, it features incredible data-driven charts and stories from many of the world’s best creators, like Ehsan Soltani.
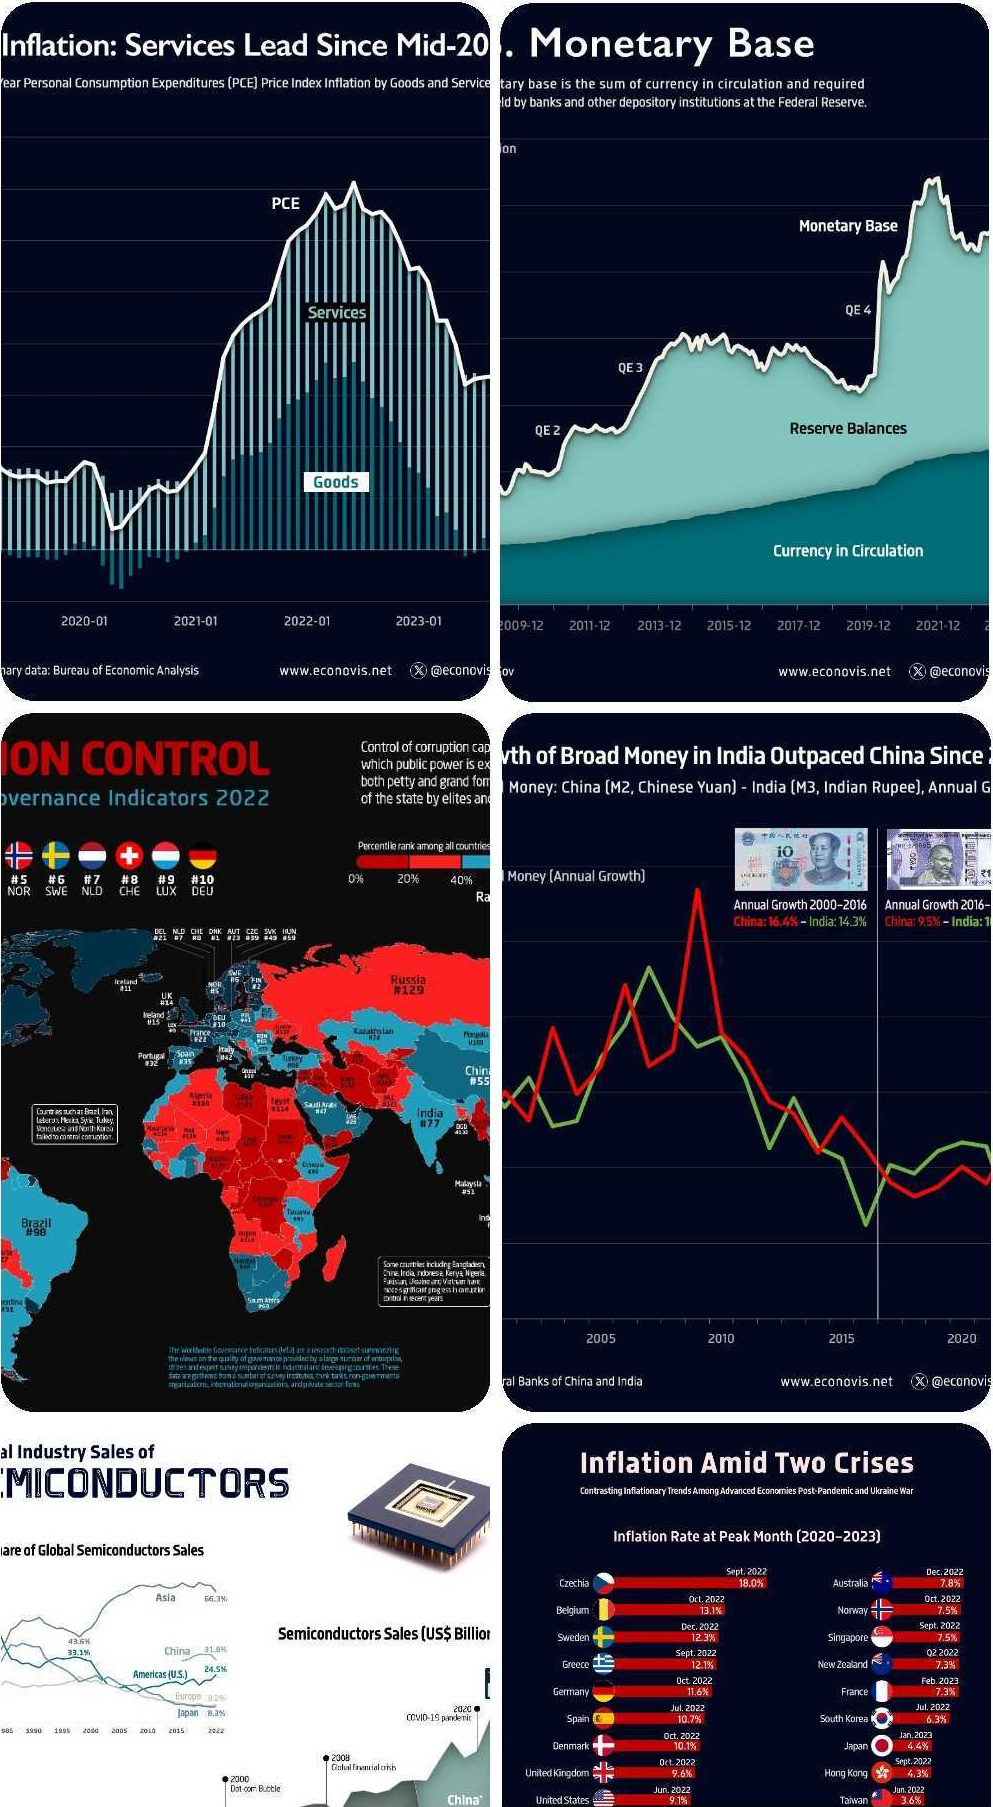
Ehsan is an economist, and one of the most prolific creators on Voronoi so far. He’s published 41 visualizations on wide-ranging subjects such as:
- The world’s biggest “money printer” economies
- Global commodity returns
- Corruption by country
- Inflation rates in advanced economies
For those interested in what’s happening with the global economy, Ehsan Soltani is definitely worth a follow!
![]() View all of Ehsan’s visuals on Voronoi today.
View all of Ehsan’s visuals on Voronoi today.
MOST VIEWED
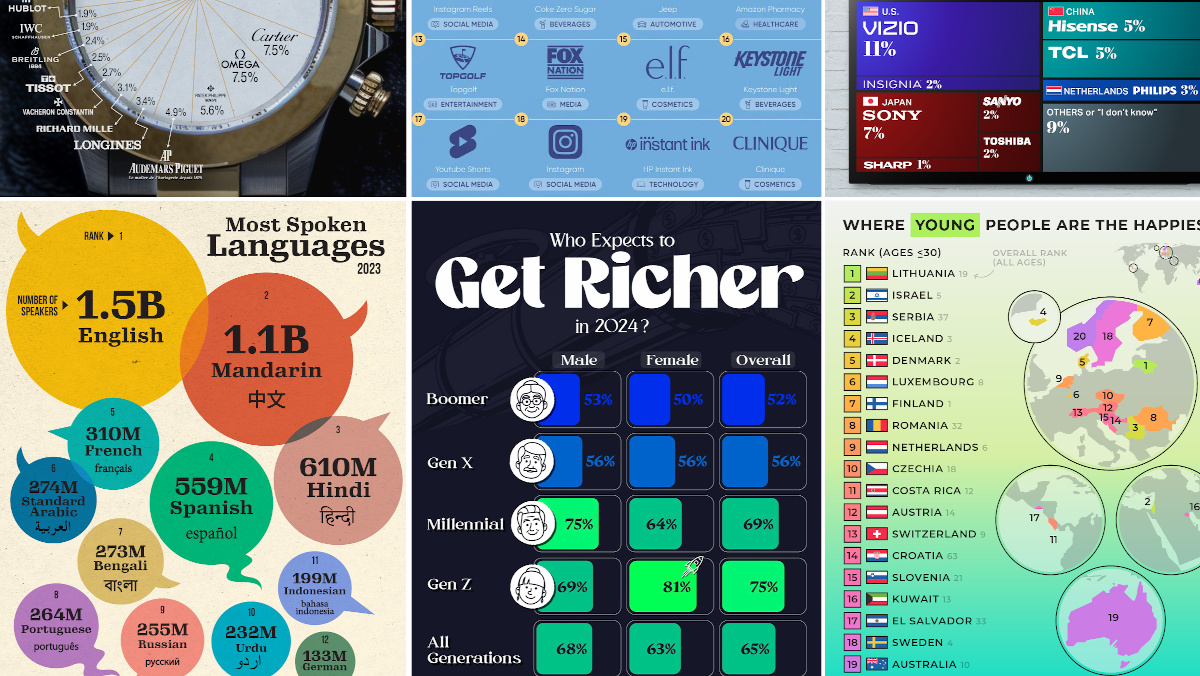
The 12 Most Spoken Languages in 2023
Which languages are most commonly spoken around the world by native speakers?
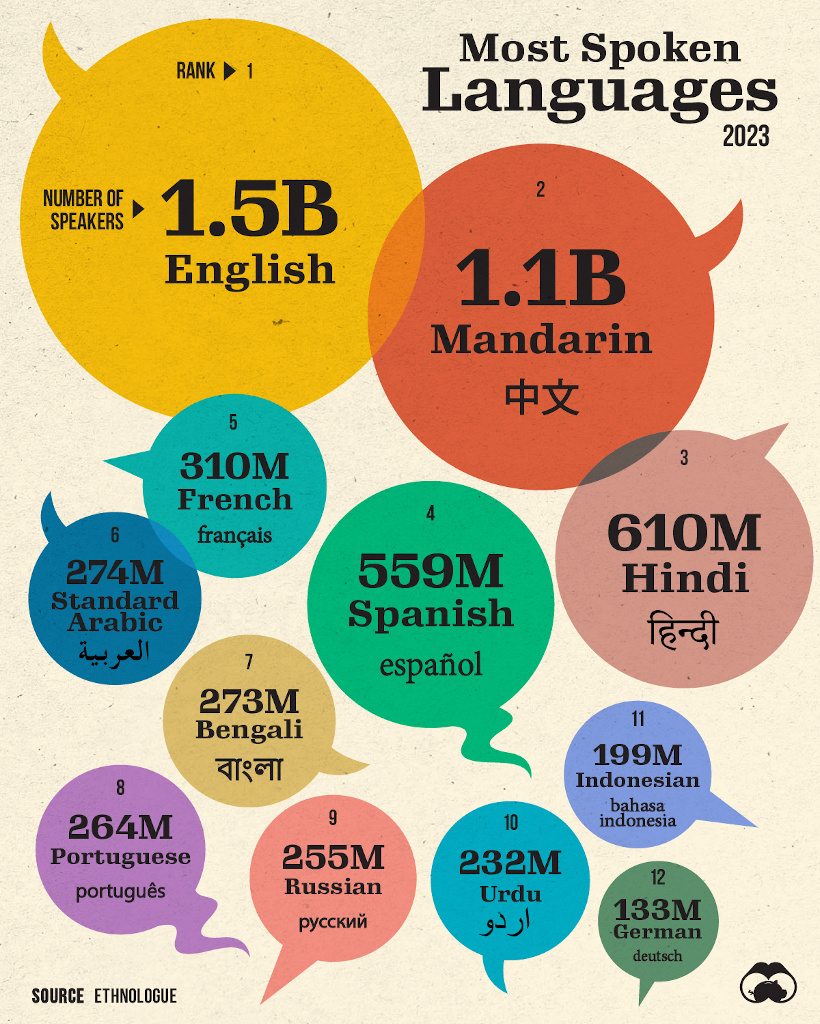
This visualization from Visual Capitalist was one of the most viewed by users, and it highlights the top languages spoken around the world.
Data here comes from the Ethnologue database, the most rigorous and comprehensive language database globally. It’s worth noting that it highlights languages spoken by native speakers only, so second languages are not counted here.
![]() Get the data behind this visual on Voronoi today.
Get the data behind this visual on Voronoi today.
MOST DISCUSSED
Where Young People are Happiest
The most commented on visualization from Visual Capitalist showed the countries with the happiest young people (under 30 years old).
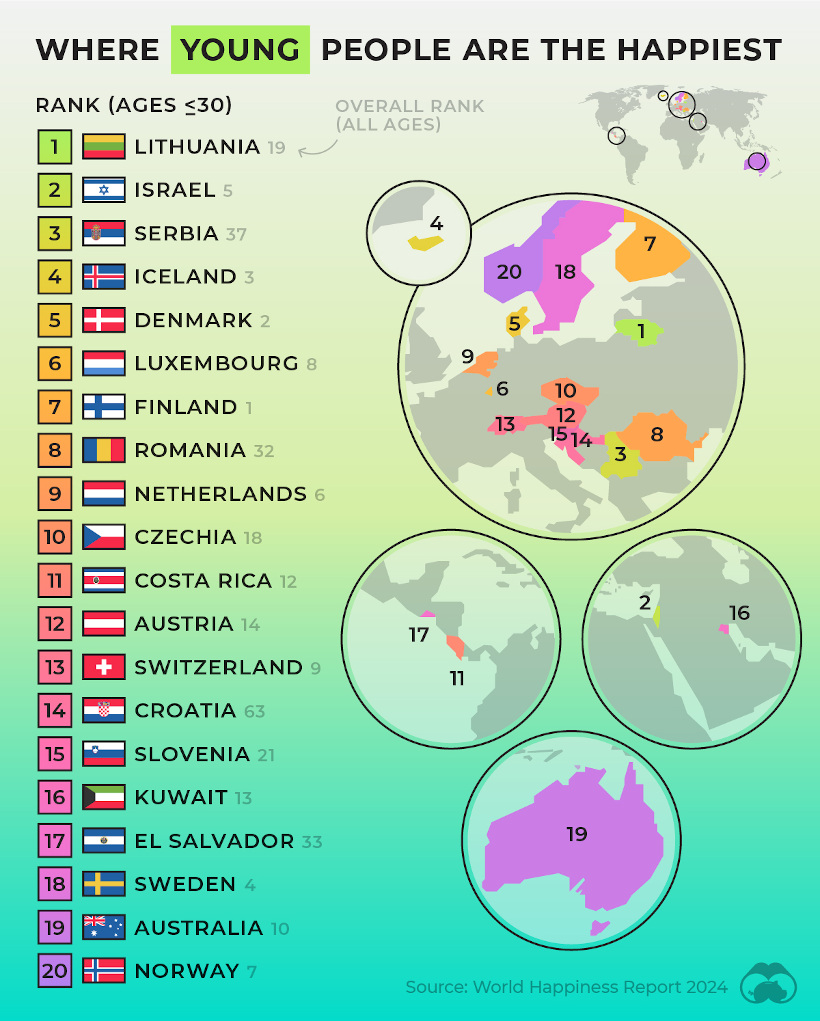
This comes from the World Happiness Report, which Visual Capitalist covers extensively every year.
In this year’s edition, one particularly interesting feature focused on happiness discrepancies between age groups. For example, in some countries, younger people were much happier than the average population—in others, older populations were far happier.
![]() To join the conversation, download Voronoi today.
To join the conversation, download Voronoi today.
MOST LIKED
The Fastest Growing Brands in the U.S.
The most liked visual on Voronoi in March came from Visual Capitalist, showing the brands that are growing the fastest in the United States.
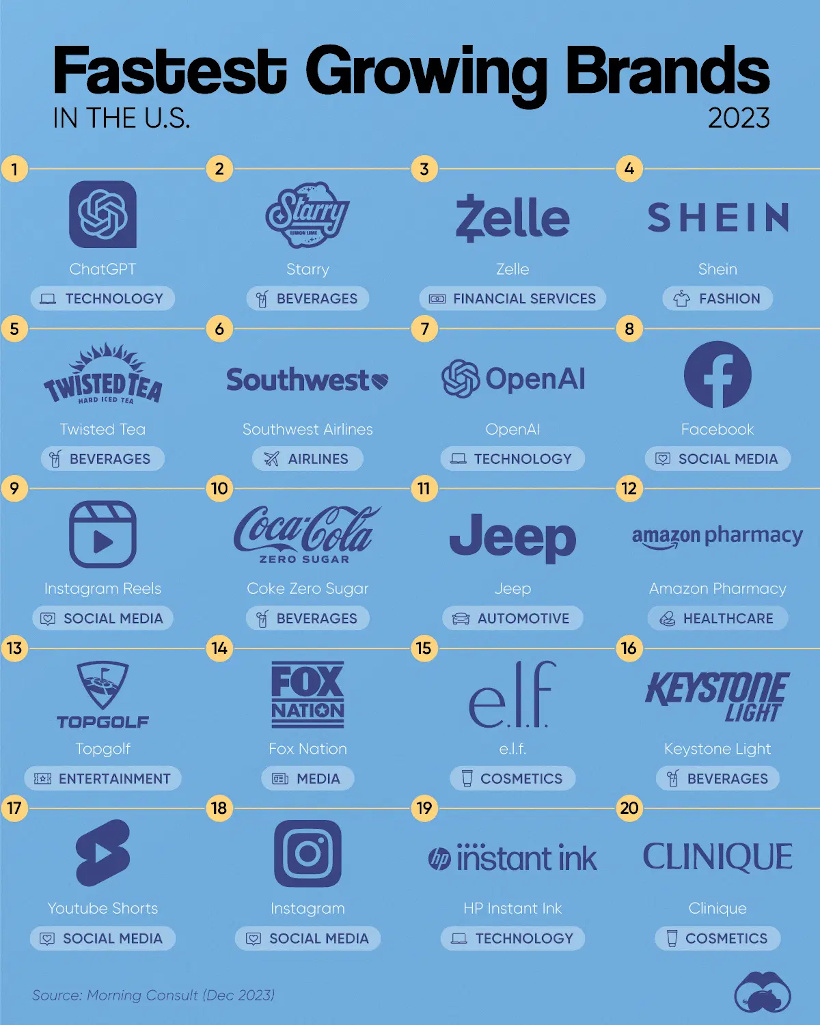
The data here comes from Morning Consult, and shows the share of customers that were considering purchasing a brand in October 1-24, 2023, and subtracted the share of those who said the same between Jan 1-31, 2023.
![]() Get the data behind this visual on Voronoi today.
Get the data behind this visual on Voronoi today.

-

 Maps2 weeks ago
Mapped: Average Wages Across Europe
-

 Money1 week ago
Which States Have the Highest Minimum Wage in America?
-

 Real Estate1 week ago
Ranked: The Most Valuable Housing Markets in America
-

 Markets1 week ago
Charted: Big Four Market Share by S&P 500 Audits
-

 AI1 week ago
The Stock Performance of U.S. Chipmakers So Far in 2024
-

 Automotive1 week ago
Almost Every EV Stock is Down After Q1 2024
-

 Money2 weeks ago
Where Does One U.S. Tax Dollar Go?
-

 Green2 weeks ago
Ranked: Top Countries by Total Forest Loss Since 2001