Energy
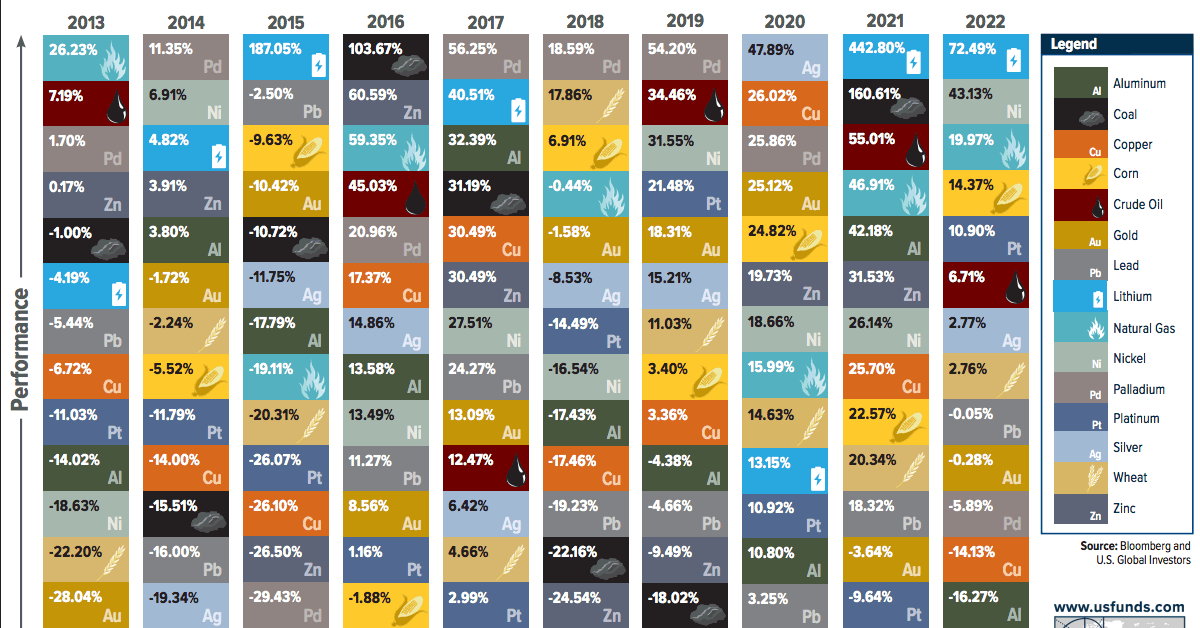
The Periodic Table of Commodity Returns (2013-2022)
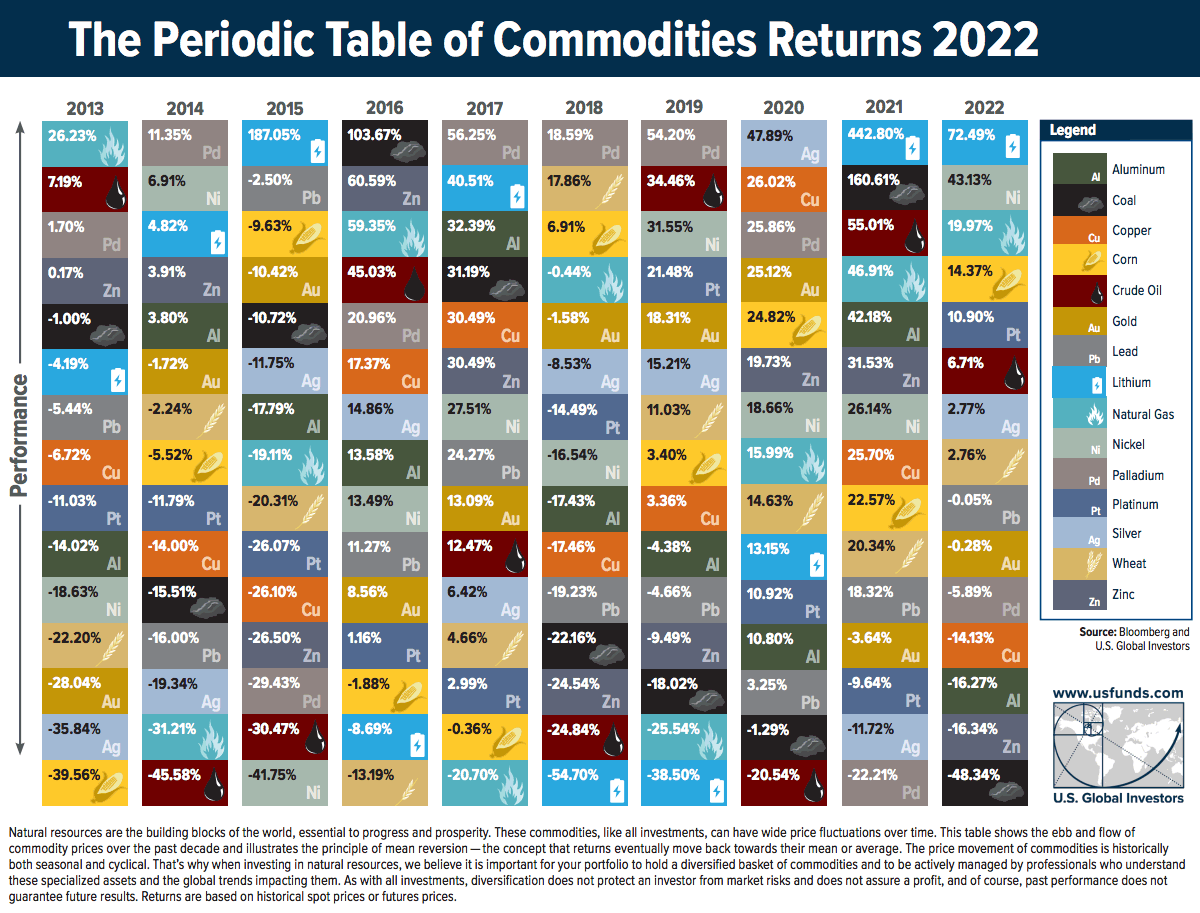
The Periodic Table of Commodity Returns (2013-2022)
Trying to predict which commodities will come out on top in any given year is tricky business—especially during this turbulent period in markets.
By looking back at previous years, investors can gain insights into long-term trends and patterns in commodity prices. To help better understand these trends, U.S. Global Investors releases a visualization called the Periodic Table of Commodity Returns at the outset of each year.
This year’s edition looks back over the past decade of returns between 2013 and 2022, and features an interactive design that allows users to sort returns by various categories including returns, volatility, and other groupings.
Editor’s note: Because of the Russia-Ukraine conflict, regional benchmarks for some commodities (coal, natural gas) had much bigger price divergences than is typical. In this case the graphic focuses in on U.S. regional benchmarks like Powder River Basin coal and Henry Hub natural gas prices. These prices may differ from price action seen around the world.
More Volatility, but Positive Returns
After 2021 saw an impressive surge in commodity prices as the world reopened post-pandemic, 2022 brought another year of positive returns for the asset class that were defined by high levels of volatility.
The broad-based S&P Goldman Sachs Commodity Index (GSCI) surged 52.1% in the first five months of 2022, as supply disruptions and fears across grains, metals, and energy fuels were spurred by Russia’s invasion of Ukraine.
The second half of the year saw prices cool as the U.S. continued to release crude oil from its strategic petroleum reserve while Russia and Ukraine established an agreement to enable grain and agricultural exports, quelling fears of extended supply disruptions.
The result? In the last seven months of the year the S&P GSCI nearly completed a return trip and only ended up rising 8.7% in 2022 overall.
| Commodity | 2022 Returns |
|---|---|
| Lithium | 72.49% |
| Nickel | 43.13% |
| Natural Gas (Henry Hub) | 19.97% |
| Corn | 14.37% |
| Platinum | 10.90% |
| S&P Goldman Sachs Commodity Index (GSCI) | 8.71% |
| Crude oil | 6.71% |
| Silver | 2.77% |
| Wheat | 2.76% |
| Lead | -0.05% |
| Gold | -0.28% |
| Palladium | -5.89% |
| Copper | -14.13% |
| Aluminum | -16.27% |
| Zinc | -16.34% |
| Coal (PRB) | -48.34% |
Another key factor that helped keep commodity prices cool in 2022 was China’s extended lockdowns which slowed down the country’s manufacturing and industrial capabilities. This helped reduce the demand of energy fuels in 2022, along with industrial metals like copper, aluminum, and zinc.
Lithium Continues to Top Commodity Returns
A metal that did shine brightly in 2022 was lithium, which has been newly added to the Periodic Table of Commodity Returns.
After topping the table in 2021 with an outsized price increase of 442.8%, lithium kept its top spot in 2022 with a more modest price increase of 72.5%.
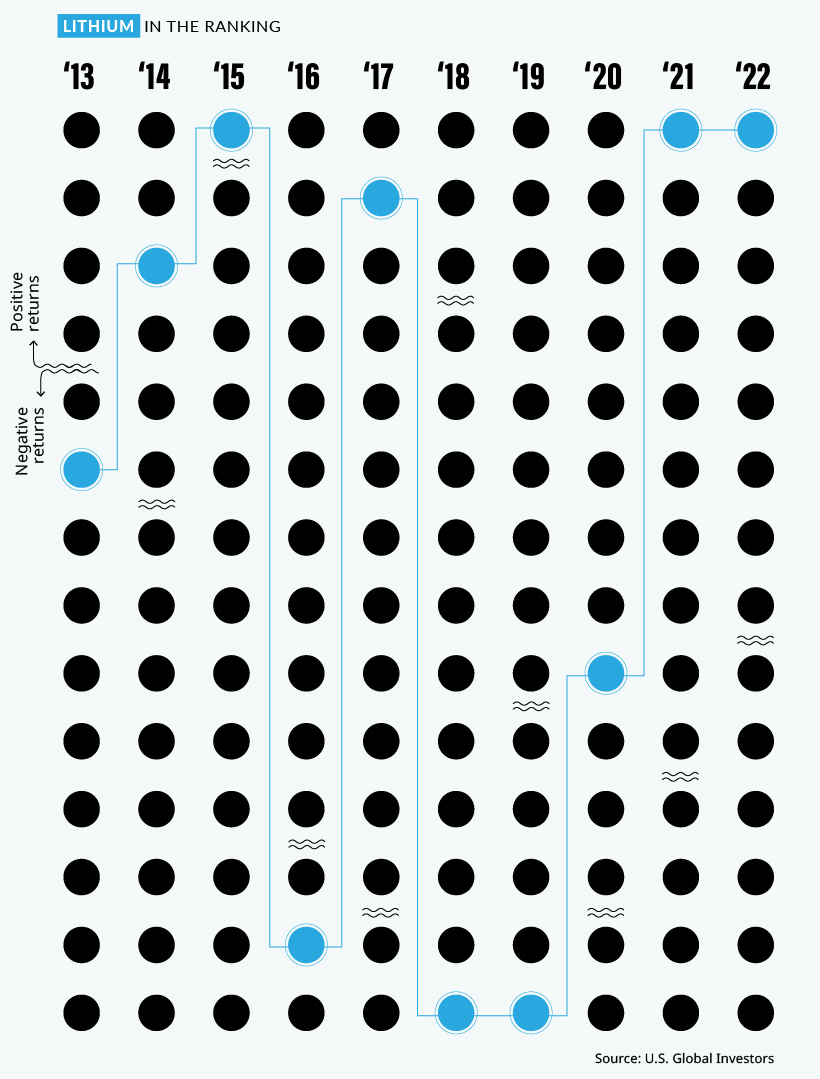
The growing global push towards electric vehicles (EVs) has been a major contributor to the increase in demand for lithium and nickel, which was the second-best performing commodity in 2022 with a price increase of 43.1%. As more countries set targets to phase out gasoline and diesel vehicles, demand for key battery minerals like lithium and nickel is expected to continue to rise.
While the U.S. is working to strengthen its battery metals production and supply chains with $2.8 billion in grants for domestic lithium, graphite, and nickel projects, it will be years before more supply comes online as a result. In the meantime, robust demand for EVs in China has provided a constant need for these battery metals which are currently in short supply.
Energy Price Variance Fueled by Regional Uncertainty
After 2021 saw energy fuels dominate the top spots after lithium, energy fuel prices in 2022 were more volatile with more scattered returns. Natural gas was the only fuel which saw double-digit returns at a 19.9%, with crude oil returning 6.7% and coal at the bottom of the table at -48.3%.
It’s important to keep in mind how geopolitical events and supply disruptions last year affected the regional price differences for energy fuels. While WTI crude oil (North America’s benchmark) increased by 6.7% in 2022, Brent crude oil (Europe’s benchmark) was up 10.4% as Urals crude oil (Russia’s benchmark) fell by more than 26.5%.
| Type of Crude Oil | 2022 Returns | Price in U.S. dollars (Jan 17, 2023) |
|---|---|---|
| Brent Crude Oil (European benchmark) | 10.35% | $86.72 |
| WTI Crude Oil (North American benchmark) | 6.72% | $81.01 |
| Urals Crude Oil (Russian benchmark) | -26.53% | $55.60 |
As a result of the war and ensuing sanctions, the discount of Urals crude oil compared to Brent crude oil went from -$1.72 at the start of 2022 all the way to -$30.71 by the end of the year.
Thermal coal prices faced similar regional divergences, with Powder River Basin (PRB) coal (America’s benchmark for coal) falling by 48.3% this year while Newcastle coal, which is delivered out of the port of Newcastle, Australia primarily to various Asian nations, saw prices skyrocket up by 156.6% in 2022.
After such a wild year with huge variance in commodity prices, we’ll see if 2023 can bring some stability or if high volatility and growing regional price discrepancies will become the norm.


Who’s Building the Most Solar Energy?
This was originally posted on our Voronoi app. Download the app for free on iOS or Android and discover incredible data-driven charts from a variety of trusted sources.
In 2023, solar energy accounted for three-quarters of renewable capacity additions worldwide. Most of this growth occurred in Asia, the EU, and the U.S., continuing a trend observed over the past decade.
In this graphic, we illustrate the rise in installed solar photovoltaic (PV) capacity in China, the EU, and the U.S. between 2010 and 2022, measured in gigawatts (GW). Bruegel compiled the data..
Chinese Dominance
As of 2022, China’s total installed capacity stands at 393 GW, nearly double that of the EU’s 205 GW and surpassing the USA’s total of 113 GW by more than threefold in absolute terms.
| Installed solar capacity (GW) | China | EU27 | U.S. |
|---|---|---|---|
| 2022 | 393.0 | 205.5 | 113.0 |
| 2021 | 307.0 | 162.7 | 95.4 |
| 2020 | 254.0 | 136.9 | 76.4 |
| 2019 | 205.0 | 120.1 | 61.6 |
| 2018 | 175.3 | 104.0 | 52.0 |
| 2017 | 130.8 | 96.2 | 43.8 |
| 2016 | 77.8 | 91.5 | 35.4 |
| 2015 | 43.6 | 87.7 | 24.2 |
| 2014 | 28.4 | 83.6 | 18.1 |
| 2013 | 17.8 | 79.7 | 13.3 |
| 2012 | 6.7 | 71.1 | 8.6 |
| 2011 | 3.1 | 53.3 | 5.6 |
| 2010 | 1.0 | 30.6 | 3.4 |
Since 2017, China has shown a compound annual growth rate (CAGR) of approximately 25% in installed PV capacity, while the USA has seen a CAGR of 21%, and the EU of 16%.
Additionally, China dominates the production of solar power components, currently controlling around 80% of the world’s solar panel supply chain.
In 2022, China’s solar industry employed 2.76 million individuals, with manufacturing roles representing approximately 1.8 million and the remaining 918,000 jobs in construction, installation, and operations and maintenance.
The EU industry employed 648,000 individuals, while the U.S. reached 264,000 jobs.
According to the IEA, China accounts for almost 60% of new renewable capacity expected to become operational globally by 2028.
Despite the phasing out of national subsidies in 2020 and 2021, deployment of solar PV in China is accelerating. The country is expected to reach its national 2030 target for wind and solar PV installations in 2024, six years ahead of schedule.

-

 Mining6 days ago
Where the World’s Aluminum is Smelted, by Country
-

 Markets2 weeks ago
Visualized: Interest Rate Forecasts for Advanced Economies
-

 Economy2 weeks ago
The Most Valuable Companies in Major EU Economies
-

 Markets2 weeks ago
The World’s Fastest Growing Emerging Markets (2024-2029 Forecast)
-

 Markets2 weeks ago
Visualizing Global Inflation Forecasts (2024-2026)
-

 Misc1 week ago
Charted: What Southeast Asia Thinks About China & the U.S.
-

 Misc1 week ago
The Evolution of U.S. Beer Logos
-

 Healthcare1 week ago
What Causes Preventable Child Deaths?