Mapped: The 10 U.S. States With the Lowest Real GDP Growth
Ranked: The World’s 50 Largest Private Equity Firms
Top 10 Countries Most in Debt to the IMF
Ranked: The Top 6 Economies by Share of Global GDP (1980-2024)
Mapped: Europe’s GDP Per Capita, by Country
Countries With the Highest Rates of Crypto Ownership
Mapped: The Number of AI Startups By Country
All of the Grants Given by the U.S. CHIPS Act
Visualizing AI Patents by Country
How Tech Logos Have Evolved Over Time
Visualizing America’s Average Retirement Savings, by Age
Visualizing the Tax Burden of Every U.S. State
Charted: What Frustrates Americans About the Tax System
Ranked: The Top 20 Countries in Debt to China
Mapped: Countries Where Recreational Cannabis is Legal
Which Countries Have the Highest Infant Mortality Rates?
Life Expectancy by Region (1950-2050F)
What Causes Preventable Child Deaths?
The Cost of an EpiPen in Major Markets
Who’s Building the Most Solar Energy?
Mapped: The Age of Energy Projects in Interconnection Queues, by State
Ranked: The Top 10 EV Battery Manufacturers in 2023
The World’s Biggest Nuclear Energy Producers
The World’s Biggest Oil Producers in 2023
Mapped: The Top Exports in Asian Countries
Mapped: U.S. States By Number of Cities Over 250,000 Residents
Mapped: U.S. Immigrants by Region
The Biggest Salt Producing Countries in 2023
Visualizing Copper Production by Country in 2023
Where the World’s Aluminum is Smelted, by Country
Visualizing Global Gold Production in 2023
How People Get Around in America, Europe, and Asia
The Carbon Footprint of Major Travel Methods
Ranking the Top 15 Countries by Carbon Tax Revenue
Ranked: The Countries With the Most Air Pollution in 2023
Top Countries By Forest Growth Since 2001
Which countries rank the highest in per capita carbon emissions, and how do they impact the world's total carbon emissions?
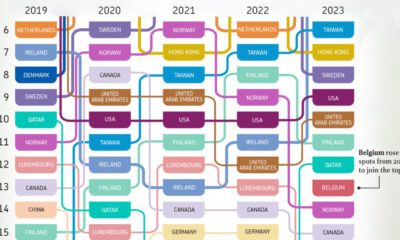
What are the most competitive countries when it comes to business? This visual highlights the top 20 economies over the last five years.
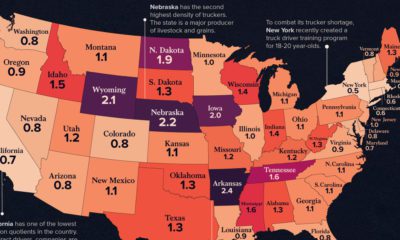
See how America's 1.8 million truckers are distributed across the nation in these two heatmap visualizations.
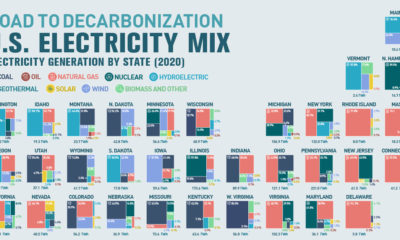
Can America become carbon-free by 2035? This graphic breaks down the United States’ electricity mix, by state.
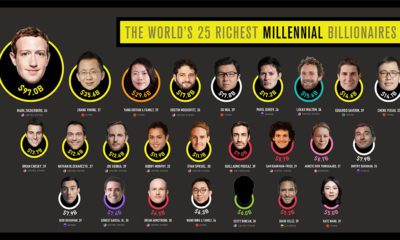
There are over 2,700 billionaires in the world, but how many are millennials? This visual breaks down the richest millennial billionaires.
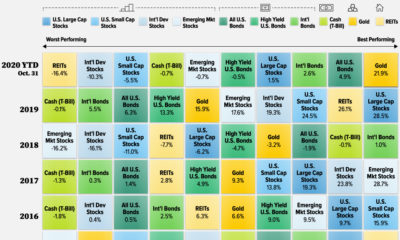
What are the best-performing investments in 2020, and how do previous years compare? This graphic shows historical returns by asset class.
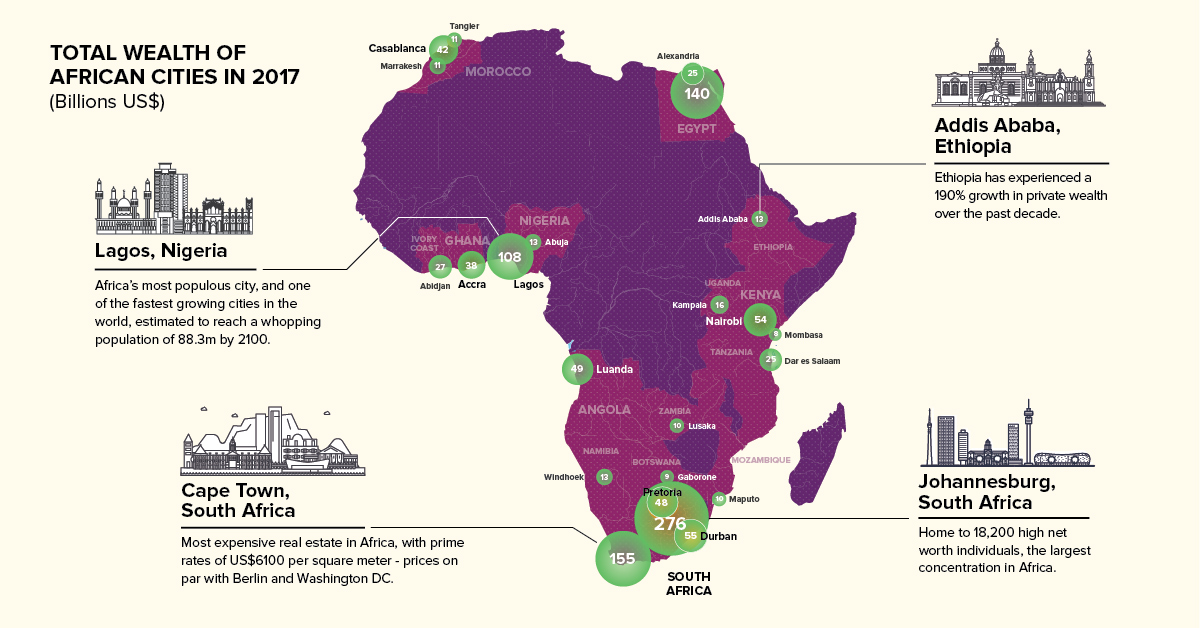
Private wealth in Africa is set to grow $800 billion in the next decade. Here are the continent's 23 richest cities mapped, along with other key...
There are over 600,000 individuals worldwide with a net worth surpassing $30 million, representing the wealthiest people on the planet. Here's where they live.
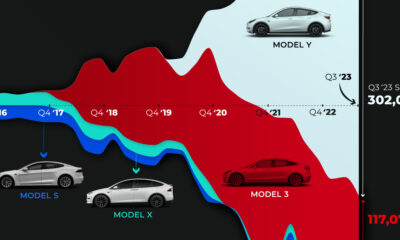
The model mix in tesla's global sales numbers has slowly changed from its luxury lineup to cheaper, high-volume cars.
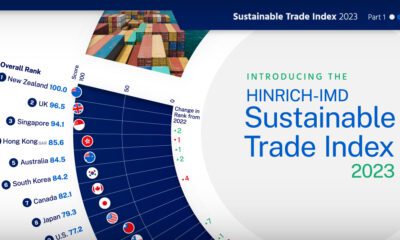
The Sustainable Trade Index 2023 is an annual ranking of the world's most sustainable economies. View this infographic to see the results.


 Creator Program