Top 10 Countries Most in Debt to the IMF
Ranked: The Top 6 Economies by Share of Global GDP (1980-2024)
Mapped: Europe’s GDP Per Capita, by Country
The Growth of a $1,000 Equity Investment, by Stock Market
Mapped: The Most Valuable Company in Each Southeast Asian Country
Countries With the Highest Rates of Crypto Ownership
Mapped: The Number of AI Startups By Country
All of the Grants Given by the U.S. CHIPS Act
Visualizing AI Patents by Country
How Tech Logos Have Evolved Over Time
Visualizing America’s Average Retirement Savings, by Age
Visualizing the Tax Burden of Every U.S. State
Charted: What Frustrates Americans About the Tax System
Ranked: The Top 20 Countries in Debt to China
Mapped: Countries Where Recreational Cannabis is Legal
Which Countries Have the Highest Infant Mortality Rates?
Life Expectancy by Region (1950-2050F)
What Causes Preventable Child Deaths?
The Cost of an EpiPen in Major Markets
Who’s Building the Most Solar Energy?
Mapped: The Age of Energy Projects in Interconnection Queues, by State
Ranked: The Top 10 EV Battery Manufacturers in 2023
The World’s Biggest Nuclear Energy Producers
The World’s Biggest Oil Producers in 2023
Mapped: U.S. States By Number of Cities Over 250,000 Residents
Mapped: U.S. Immigrants by Region
Mapped: Southeast Asia’s GDP Per Capita, by Country
The Largest Earthquakes in the New York Area (1970-2024)
The Biggest Salt Producing Countries in 2023
Visualizing Copper Production by Country in 2023
Where the World’s Aluminum is Smelted, by Country
Visualizing Global Gold Production in 2023
How People Get Around in America, Europe, and Asia
The Carbon Footprint of Major Travel Methods
Ranking the Top 15 Countries by Carbon Tax Revenue
Ranked: The Countries With the Most Air Pollution in 2023
Top Countries By Forest Growth Since 2001
A train transporting a number of potentially dangerous chemicals derailed near the Ohio–Pennsylvania border. This infographic explains what happened
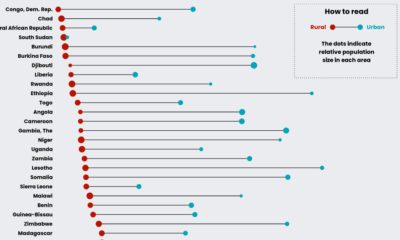
This graphic compares water accessibility in countries across Sub-Saharan Africa, showing the gap between its rural and urban populations.
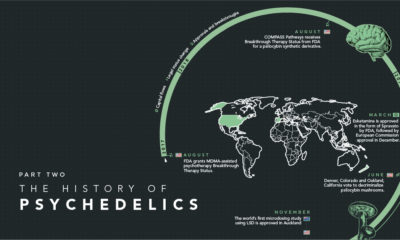
This graphic showcases the recent history of psychedelics and explores the exciting possibilities of this promising market.
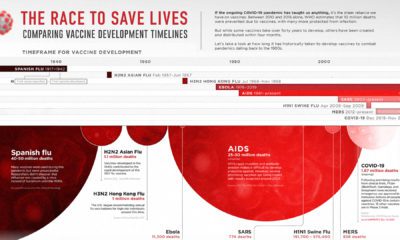
This graphic looks at how long vaccine development has historically taken for pandemics dating back to the 1900s.
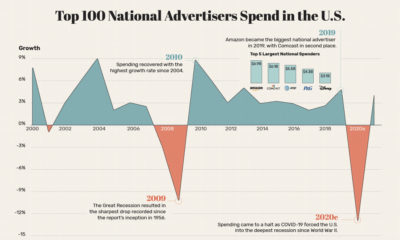
This graphic visualizes the fluctuations in advertising spend in the U.S., along with its brutal decline of 13% as a result of COVID-19.
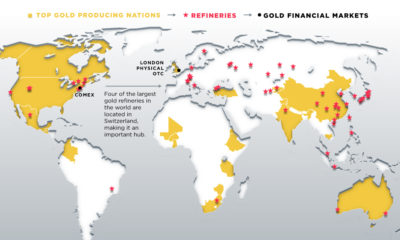
Chains are only as strong as their weakest link. The COVID-19 shutdowns affected every link in the gold supply chain, from producers to end-users.
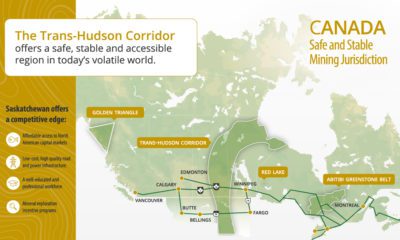
Canada is home to prolific mining regions, but there is still more to find. The Trans-Hudson Corridor could be Canada's next major gold district.
As millions of people continue to show up for work during the COVID-19 pandemic, many face a higher risk of potential exposure to the virus.
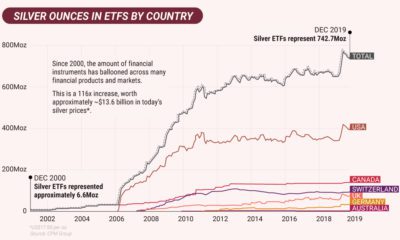
In the second part of the Silver Series, we show that the supply and demand fundamentals are potentially shaping up for a perfect storm in silver...
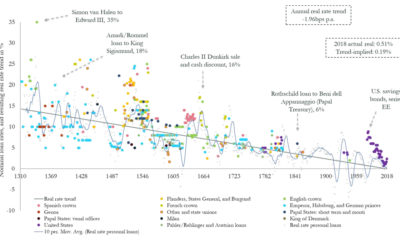
Could interest rates enter negative territory permanently? This chart plots trend data over 700 years, showing that it could be a possibility.


 Creator Program