Mapped: Europe’s GDP Per Capita, by Country
The Growth of a $1,000 Equity Investment, by Stock Market
Mapped: The Most Valuable Company in Each Southeast Asian Country
Visualizing Global Inflation Forecasts (2024-2026)
The World’s Fastest Growing Emerging Markets (2024-2029 Forecast)
Countries With the Highest Rates of Crypto Ownership
Mapped: The Number of AI Startups By Country
All of the Grants Given by the U.S. CHIPS Act
Visualizing AI Patents by Country
How Tech Logos Have Evolved Over Time
Visualizing the Tax Burden of Every U.S. State
Charted: What Frustrates Americans About the Tax System
Ranked: The Top 20 Countries in Debt to China
Charted: Which Country Has the Most Billionaires in 2024?
Charted: Which City Has the Most Billionaires in 2024?
Mapped: Countries Where Recreational Cannabis is Legal
Which Countries Have the Highest Infant Mortality Rates?
Life Expectancy by Region (1950-2050F)
What Causes Preventable Child Deaths?
The Cost of an EpiPen in Major Markets
Who’s Building the Most Solar Energy?
Mapped: The Age of Energy Projects in Interconnection Queues, by State
Ranked: The Top 10 EV Battery Manufacturers in 2023
The World’s Biggest Nuclear Energy Producers
The World’s Biggest Oil Producers in 2023
Mapped: U.S. States By Number of Cities Over 250,000 Residents
Mapped: U.S. Immigrants by Region
Mapped: Southeast Asia’s GDP Per Capita, by Country
The Largest Earthquakes in the New York Area (1970-2024)
The Biggest Salt Producing Countries in 2023
Visualizing Copper Production by Country in 2023
Where the World’s Aluminum is Smelted, by Country
Visualizing Global Gold Production in 2023
How People Get Around in America, Europe, and Asia
The Carbon Footprint of Major Travel Methods
Ranking the Top 15 Countries by Carbon Tax Revenue
Ranked: The Countries With the Most Air Pollution in 2023
Top Countries By Forest Growth Since 2001
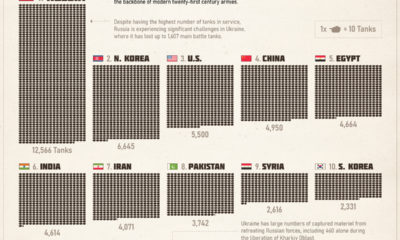
The tank remains the backbone of modern twenty-first century armies. This infographic shows what countries have the largest combat fleets.
In this eighth edition of our yearly round-up, we highlight visualizations that broke new ground in design and data-driven reporting.
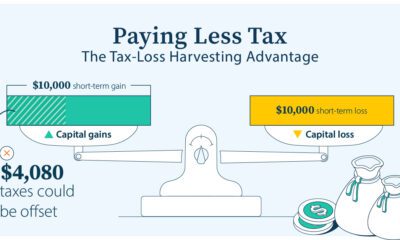
Learn how tax-loss harvesting works by using capital losses to offset capital gains, potentially reducing your tax bill.
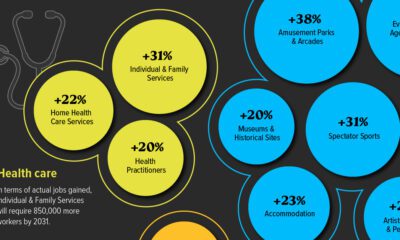
Key sectors in the U.S.—including Leisure and Health Social Services—are projected to be the fastest growing industries over the next decade.
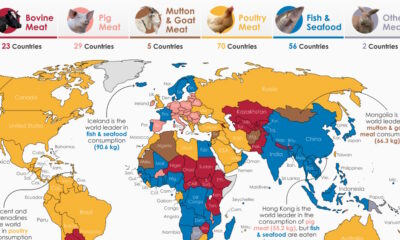
By examining meat consumption by country, we uncover regional differences in how much, and what type of meat people around the world prefer.
Analyzing 2023 per capita GDP numbers from the International Monetary Fund lets us know where the richest countries in the world are.
Analyzing 2023 per capita GDP numbers from the International Monetary Fund lets us know where the poorest countries are.
In this visual, we've ranked the top U.S. metropolitan areas in terms of their GDP. How does your city rank?
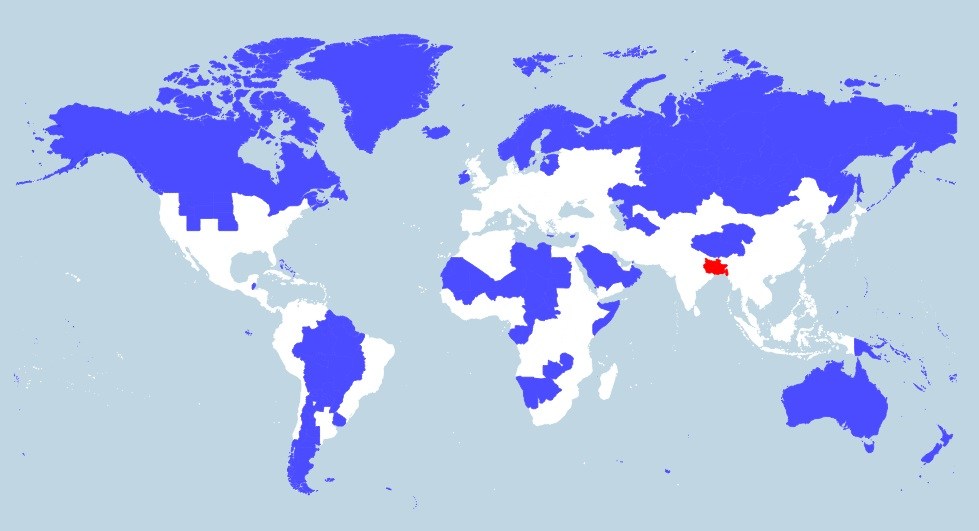
More people live in the tiny red region than all of the blue areas combined. This map really shows the disparity in population density throughout the...
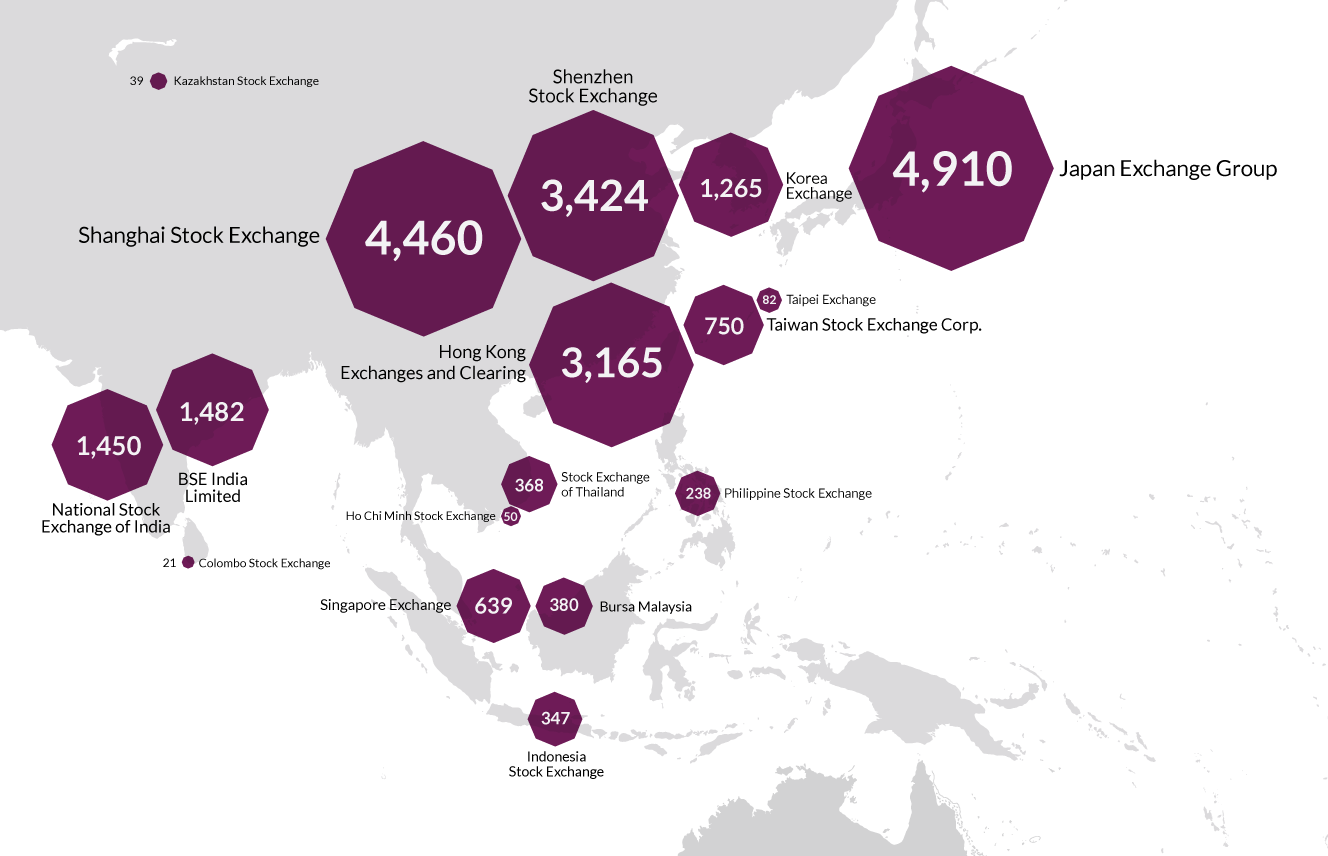
There's 60 major stock exchanges in the world, ranging from the mighty NYSE to the tiny Bermuda stock market. Here they all are visualized by size...


 Creator Program