Mapped: The 10 U.S. States With the Lowest Real GDP Growth
Ranked: The World’s 50 Largest Private Equity Firms
Top 10 Countries Most in Debt to the IMF
Ranked: The Top 6 Economies by Share of Global GDP (1980-2024)
Mapped: Europe’s GDP Per Capita, by Country
Countries With the Highest Rates of Crypto Ownership
Mapped: The Number of AI Startups By Country
All of the Grants Given by the U.S. CHIPS Act
Visualizing AI Patents by Country
How Tech Logos Have Evolved Over Time
Visualizing America’s Average Retirement Savings, by Age
Visualizing the Tax Burden of Every U.S. State
Charted: What Frustrates Americans About the Tax System
Ranked: The Top 20 Countries in Debt to China
Mapped: Countries Where Recreational Cannabis is Legal
Which Countries Have the Highest Infant Mortality Rates?
Life Expectancy by Region (1950-2050F)
What Causes Preventable Child Deaths?
The Cost of an EpiPen in Major Markets
Who’s Building the Most Solar Energy?
Mapped: The Age of Energy Projects in Interconnection Queues, by State
Ranked: The Top 10 EV Battery Manufacturers in 2023
The World’s Biggest Nuclear Energy Producers
The World’s Biggest Oil Producers in 2023
Mapped: The Top Exports in Asian Countries
Mapped: U.S. States By Number of Cities Over 250,000 Residents
Mapped: U.S. Immigrants by Region
The Biggest Salt Producing Countries in 2023
Visualizing Copper Production by Country in 2023
Where the World’s Aluminum is Smelted, by Country
Visualizing Global Gold Production in 2023
How People Get Around in America, Europe, and Asia
The Carbon Footprint of Major Travel Methods
Ranking the Top 15 Countries by Carbon Tax Revenue
Ranked: The Countries With the Most Air Pollution in 2023
Top Countries By Forest Growth Since 2001
By embracing uncertainty and making timely pivots, we visualize the bizarre origin stories of the most successful tech companies today.
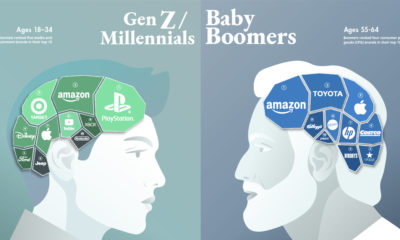
Can a brand transcend time and be all things to all people? This graphic seeks to find out by visualizing the most loved brands by generation.
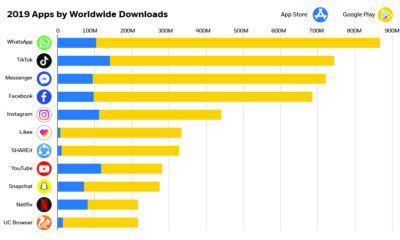
The app economy is expected to be over $6 trillion by 2021—see the world's most downloaded apps and how they're driving the future of this market.
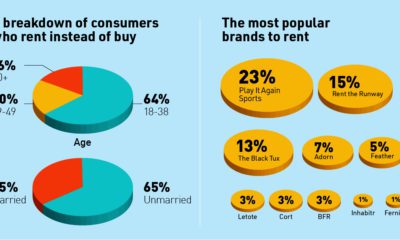
Today's infographic explores how the millennial generation are fueling the short-term rental industry—is it a passing fad or a shift in buyer behavior?
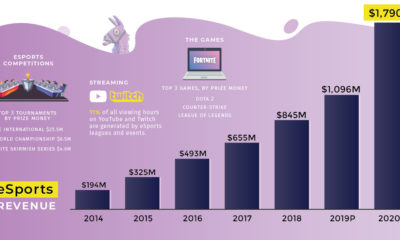
eSports has evolved into a billion dollar industry in just a decade, but how does it fare against traditional sports when it comes to monetization?
Everything you need to know about the eSports Boom, including the sector's rapid growth, massive prize pools, and the most valuable eSports companies today.
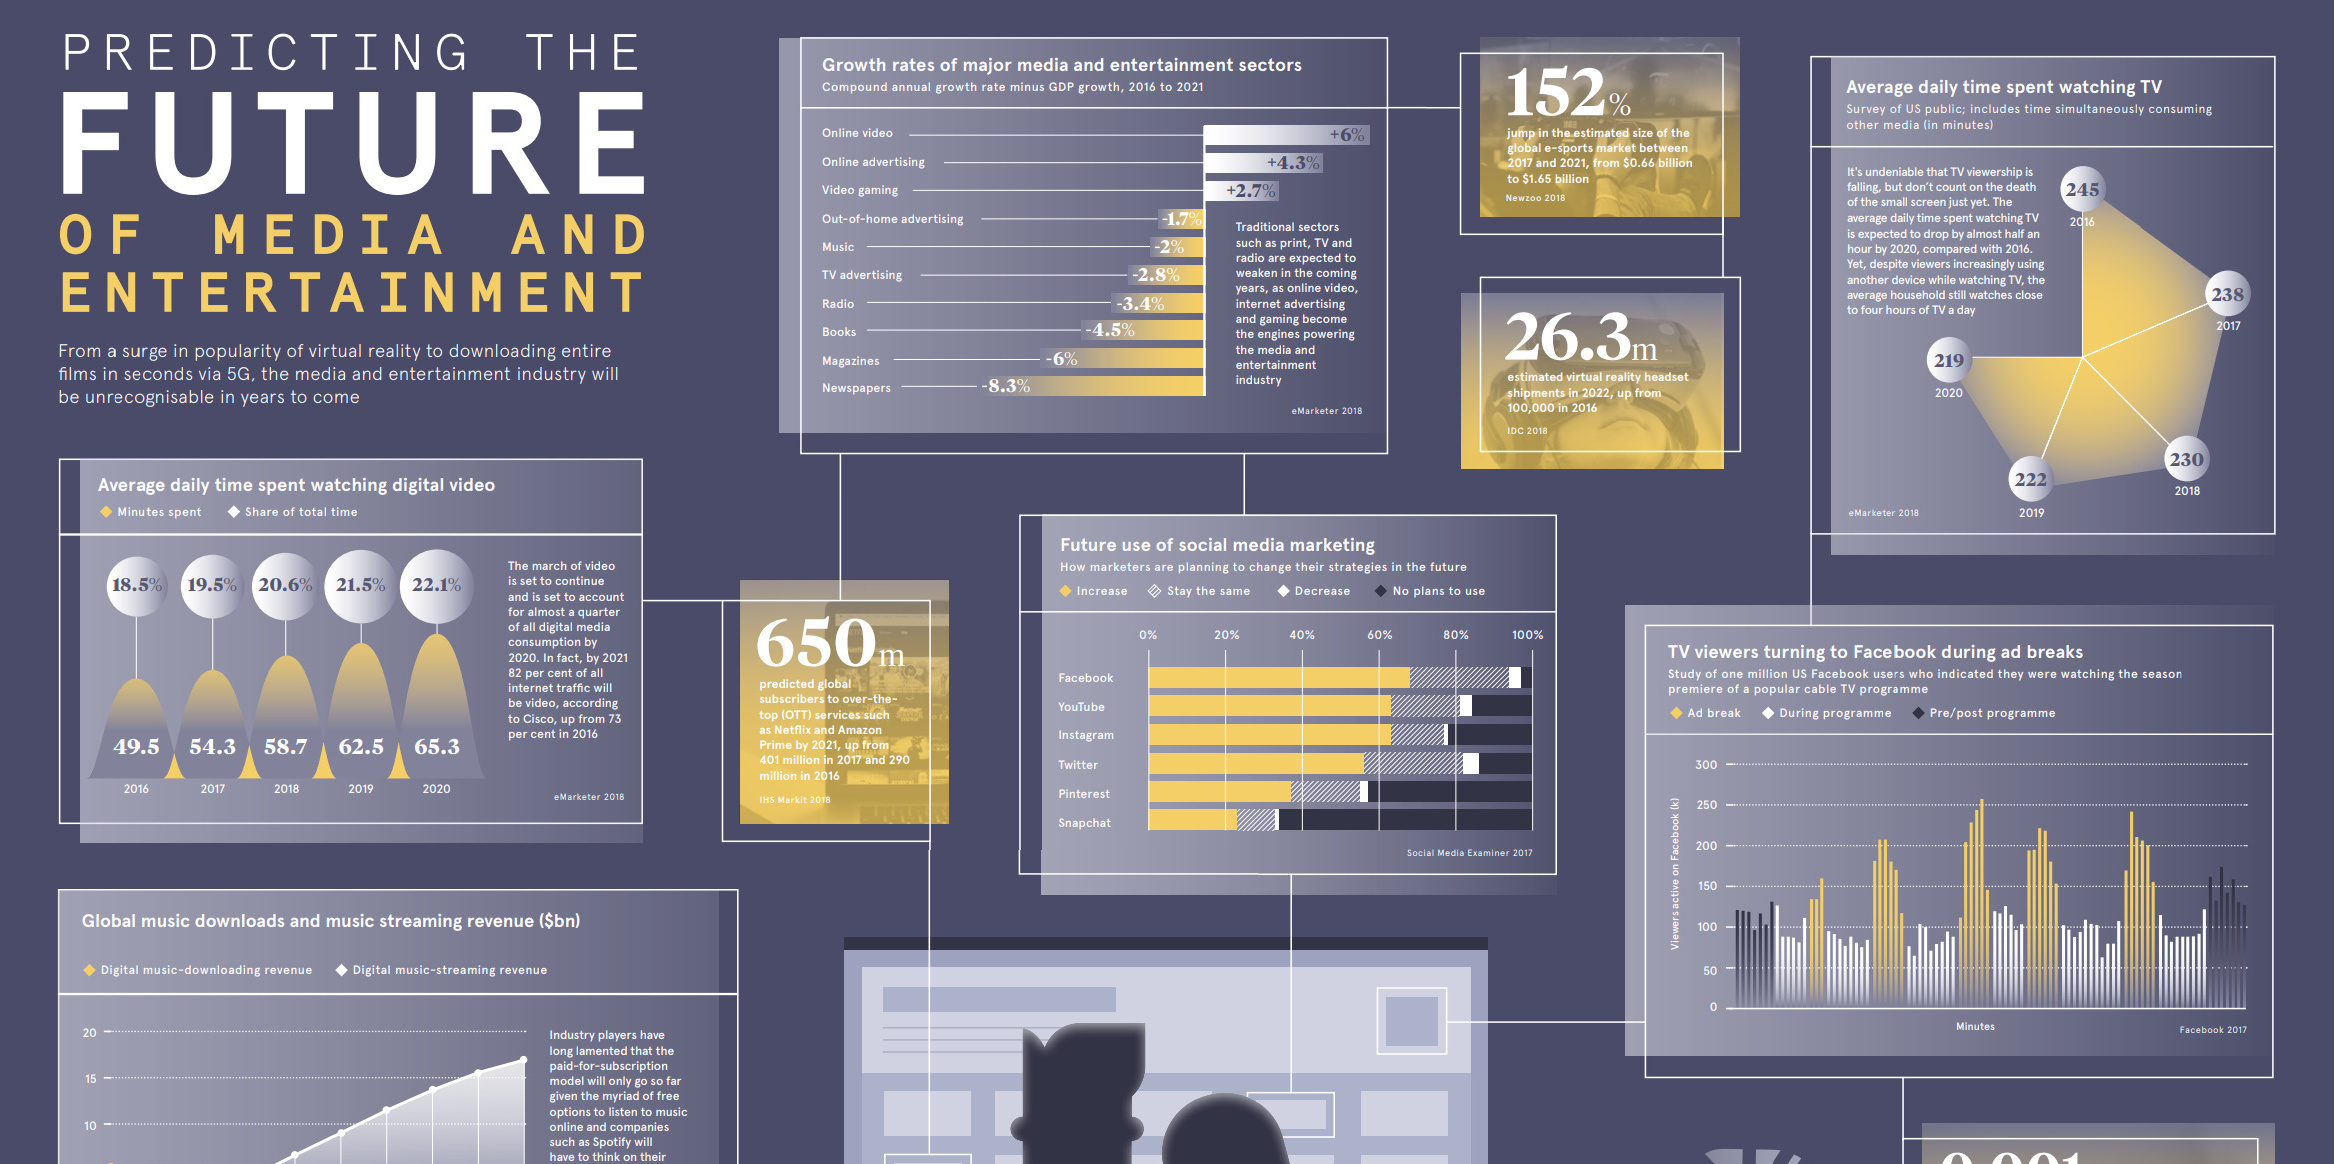
What technologies and trends are driving the future of media and entertainment? See the data in this large and information-packed infographic.
Video game tournaments are packing stadiums, offering huge prize payouts, and signing giant media deals. Learn about the wild growth of the business of eSports.
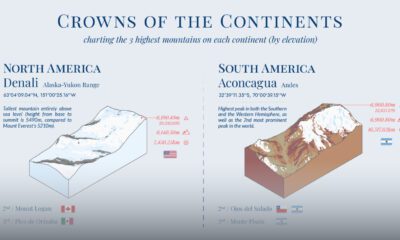
What are the highest mountains in different parts of the world? This visual maps the three tallest mountains by elevation in each continent.
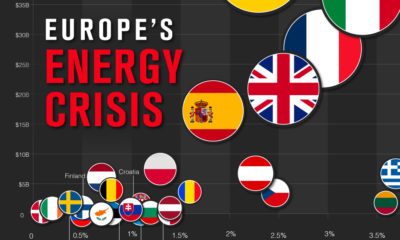
As European gas prices soar, countries are introducing policies to try and curb the energy crisis.


 Creator Program