Demographics
Generation Rent: How Millennials are Fueling the Rental Economy
It’s long been said that millennials have the power to disrupt and reshape entire industries.
Most recently, this effect has been seen in the retail landscape, where millennial spending habits are setting the tone for the market’s future.
Not only does the millennial generation demand the convenience of making instant purchases—but they can now rent almost anything they want, anytime, and anywhere.
Visualizing the Growth of the Rental Economy
Today’s infographic from Adweek takes a deeper look at the consumer goods rental economy, and the potential long-term impact of this shift in buyer behavior.
Although the current market for rentals is still in its early stages, the sheer momentum that the industry has gained in the last year is enough to threaten even the largest retailers—forcing them to reconsider their own business models.
The data for the visualization above comes from market research company Lab 42. In a survey of 500 people, they found that 94% of the U.S. population has participated in the sharing economy in one way or another.
While the sharing economy spotlight typically shines on global behemoths like Airbnb and Uber, the research used to populate this infographic focuses on renting consumer goods for a short period of time, as a sub-segment of the sharing economy.
The Renting Revolution
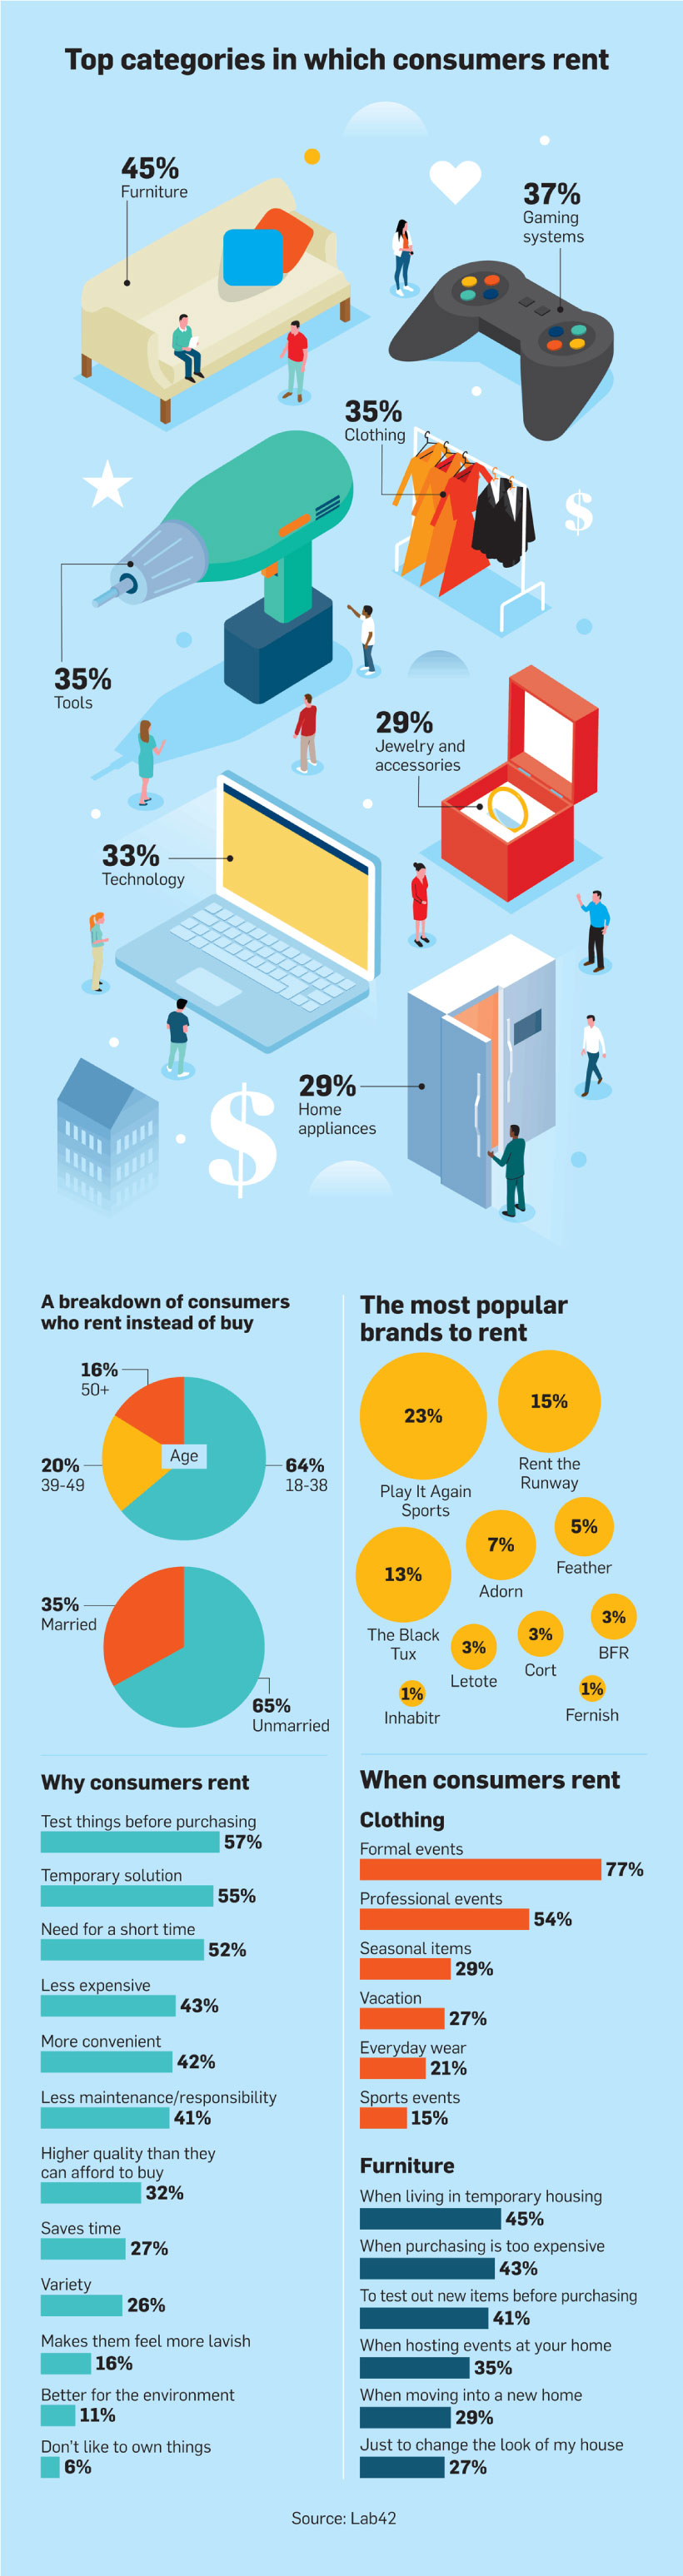
Offerings within the rental sector have exploded over the last decade, with furniture being the number one category that consumers rent.
According to the infographic, reasons for renting furniture include:
- Temporary housing: 45%
- Expensive upfront costs: 43%
- Testing products before committing: 41%
- Hosting events at home: 35%
- Moving into a new home: 29%
- Redesigning a house: 27%
Other products that consumers rent include gaming systems, clothes, tools, and technology. Female renters are more likely to rent furniture, clothes, and jewelry, while male renters are more likely to rent tools and gaming systems.
Renting goods is predominantly done on an as-needed basis. The Lab 42 report states that for clothing, 77% of respondents indicate that they either rent, or would rent for a formal event.
The End of Ownership?
Despite the common misconception that millennials are driven by emotional needs, the reasons behind why they rent consumer goods are much more pragmatic.
- Test things before purchasing: 57%
- Need a temporary solution: 55%
- Need an item or a service for a short time-frame : 52%
- Less expensive than buying: 43%
- More convenient than buying: 42%
Further, only 6% said that they rent because they do not like owning things. This tells us that the rental economy does not indicate the end of ownership, but rather, provides a strategy for consumers to try before they buy.
Attitudes Towards Sustainability
According to the research, very few millennials choose to rent consumer goods because it is better for the environment. However, Nielsen claim that 73% of millennials are willing to pay more money for sustainable offerings—impacting both retail and rental industries.
As evidence of this, Ikea will test a range of subscription-based leasing offers in all 30 of its markets by 2020 in a bid to appeal to environmentally conscious consumers and boost its sustainability credentials. If Ikea’s evolving business model is a success, it could open the floodgates for others to follow suit.
A Promising Market
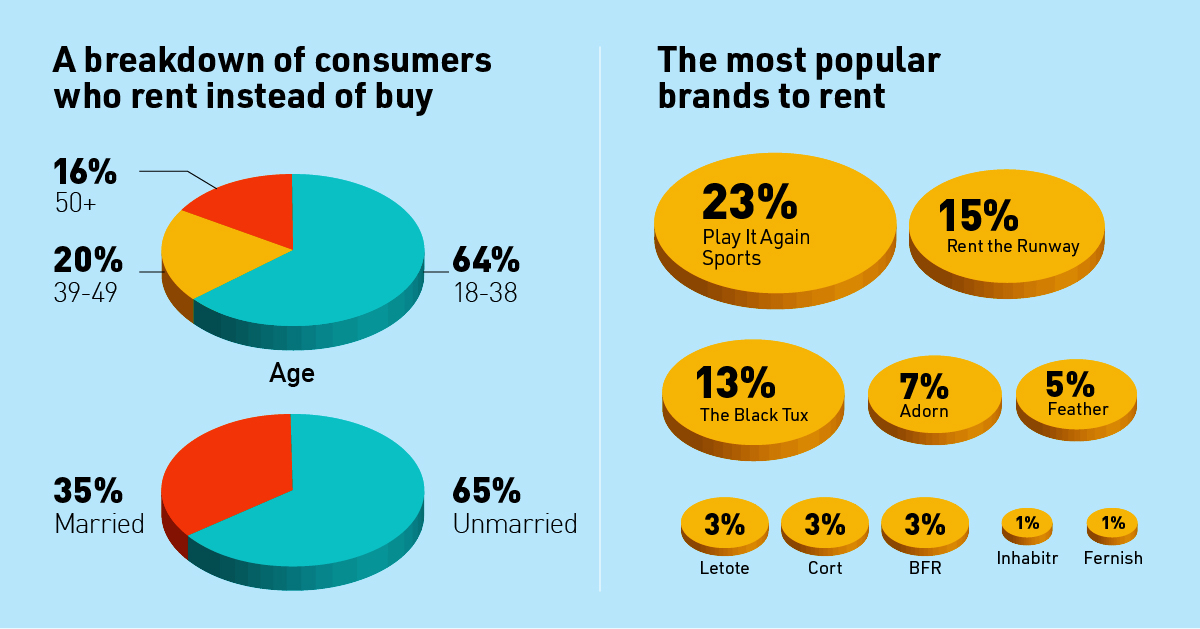
In the clothing rental space, brands like Rent the Runway pave the way, but there has also been an explosion of startups entering the market in the last year.
One example is the monthly subscription service Nuuly. The company offers consumers access to over 100 third-party brands and vintage items. Consumers can borrow up to six items a month for $88. Similarly, American Eagle’s Style Drop program rents out the latest collections for a flat monthly fee of $49.95.
As more companies incorporate short-term rental services into their offerings, more millennials will shift their behavior from buying to renting—disrupting the traditional retail business model as we know it. With that being said, the impact of millennials having it all, and owning none of it, is yet to be determined.


Demographics
The Countries That Have Become Sadder Since 2010
Tracking Gallup survey data for more than a decade reveals some countries are witnessing big happiness declines, reflecting their shifting socio-economic conditions.


The Countries That Have Become Sadder Since 2010
This was originally posted on our Voronoi app. Download the app for free on iOS or Android and discover incredible data-driven charts from a variety of trusted sources.
Can happiness be quantified?
Some approaches that try to answer this question make a distinction between two differing components of happiness: a daily experience part, and a more general life evaluation (which includes how people think about their life as a whole).
The World Happiness Report—first launched in 2012—has been making a serious go at quantifying happiness, by examining Gallup poll data that asks respondents in nearly every country to evaluate their life on a 0–10 scale. From this they extrapolate a single “happiness score” out of 10 to compare how happy (or unhappy) countries are.
More than a decade later, the 2024 World Happiness Report continues the mission. Its latest findings also include how some countries have become sadder in the intervening years.
Which Countries Have Become Unhappier Since 2010?
Afghanistan is the unhappiest country in the world right now, and is also 60% unhappier than over a decade ago, indicating how much life has worsened since 2010.
In 2021, the Taliban officially returned to power in Afghanistan, after nearly two decades of American occupation in the country. The Islamic fundamentalist group has made life harder, especially for women, who are restricted from pursuing higher education, travel, and work.
On a broader scale, the Afghan economy has suffered post-Taliban takeover, with various consequent effects: mass unemployment, a drop in income, malnutrition, and a crumbling healthcare system.
| Rank | Country | Happiness Score Loss (2010–24) | 2024 Happiness Score (out of 10) |
|---|---|---|---|
| 1 | 🇦🇫 Afghanistan | -2.6 | 1.7 |
| 2 | 🇱🇧 Lebanon | -2.3 | 2.7 |
| 3 | 🇯🇴 Jordan | -1.5 | 4.2 |
| 4 | 🇻🇪 Venezuela | -1.3 | 5.6 |
| 5 | 🇲🇼 Malawi | -1.2 | 3.4 |
| 6 | 🇿🇲 Zambia | -1.2 | 3.5 |
| 7 | 🇧🇼 Botswana | -1.2 | 3.4 |
| 8 | 🇾🇪 Yemen | -1.0 | 3.6 |
| 9 | 🇪🇬 Egypt | -1.0 | 4.0 |
| 10 | 🇮🇳 India | -0.9 | 4.1 |
| 11 | 🇧🇩 Bangladesh | -0.9 | 3.9 |
| 12 | 🇨🇩 DRC | -0.7 | 3.3 |
| 13 | 🇹🇳 Tunisia | -0.7 | 4.4 |
| 14 | 🇨🇦 Canada | -0.6 | 6.9 |
| 15 | 🇺🇸 U.S. | -0.6 | 6.7 |
| 16 | 🇨🇴 Colombia | -0.5 | 5.7 |
| 17 | 🇵🇦 Panama | -0.5 | 6.4 |
| 18 | 🇵🇰 Pakistan | -0.5 | 4.7 |
| 19 | 🇿🇼 Zimbabwe | -0.5 | 3.3 |
| 20 | 🇮🇪 Ireland | -0.5 | 6.8 |
| N/A | 🌍 World | +0.1 | 5.5 |
Nine countries in total saw their happiness score drop by a full point or more, on the 0–10 scale.
Noticeably, many of them have seen years of social and economic upheaval. Lebanon, for example, has been grappling with decades of corruption, and a severe liquidity crisis since 2019 that has resulted in a banking system collapse, sending poverty levels skyrocketing.
In Jordan, unprecedented population growth—from refugees leaving Iraq and Syria—has aggravated unemployment rates. A somewhat abrupt change in the line of succession has also raised concerns about political stability in the country.

-

 Mining1 week ago
Gold vs. S&P 500: Which Has Grown More Over Five Years?
-

 Markets2 weeks ago
Ranked: The Most Valuable Housing Markets in America
-

 Money2 weeks ago
Which States Have the Highest Minimum Wage in America?
-

 AI2 weeks ago
Ranked: Semiconductor Companies by Industry Revenue Share
-

 Markets2 weeks ago
Ranked: The World’s Top Flight Routes, by Revenue
-

 Countries2 weeks ago
Population Projections: The World’s 6 Largest Countries in 2075
-

 Markets2 weeks ago
The Top 10 States by Real GDP Growth in 2023
-

 Demographics2 weeks ago
The Smallest Gender Wage Gaps in OECD Countries