Mapped: The 10 U.S. States With the Lowest Real GDP Growth
Ranked: The World’s 50 Largest Private Equity Firms
Top 10 Countries Most in Debt to the IMF
Ranked: The Top 6 Economies by Share of Global GDP (1980-2024)
Mapped: Europe’s GDP Per Capita, by Country
Countries With the Highest Rates of Crypto Ownership
Mapped: The Number of AI Startups By Country
All of the Grants Given by the U.S. CHIPS Act
Visualizing AI Patents by Country
How Tech Logos Have Evolved Over Time
Visualizing America’s Average Retirement Savings, by Age
Visualizing the Tax Burden of Every U.S. State
Charted: What Frustrates Americans About the Tax System
Ranked: The Top 20 Countries in Debt to China
Mapped: Countries Where Recreational Cannabis is Legal
Which Countries Have the Highest Infant Mortality Rates?
Life Expectancy by Region (1950-2050F)
What Causes Preventable Child Deaths?
The Cost of an EpiPen in Major Markets
Who’s Building the Most Solar Energy?
Mapped: The Age of Energy Projects in Interconnection Queues, by State
Ranked: The Top 10 EV Battery Manufacturers in 2023
The World’s Biggest Nuclear Energy Producers
The World’s Biggest Oil Producers in 2023
Mapped: The Top Exports in Asian Countries
Mapped: U.S. States By Number of Cities Over 250,000 Residents
Mapped: U.S. Immigrants by Region
The Biggest Salt Producing Countries in 2023
Visualizing Copper Production by Country in 2023
Where the World’s Aluminum is Smelted, by Country
Visualizing Global Gold Production in 2023
How People Get Around in America, Europe, and Asia
The Carbon Footprint of Major Travel Methods
Ranking the Top 15 Countries by Carbon Tax Revenue
Ranked: The Countries With the Most Air Pollution in 2023
Top Countries By Forest Growth Since 2001
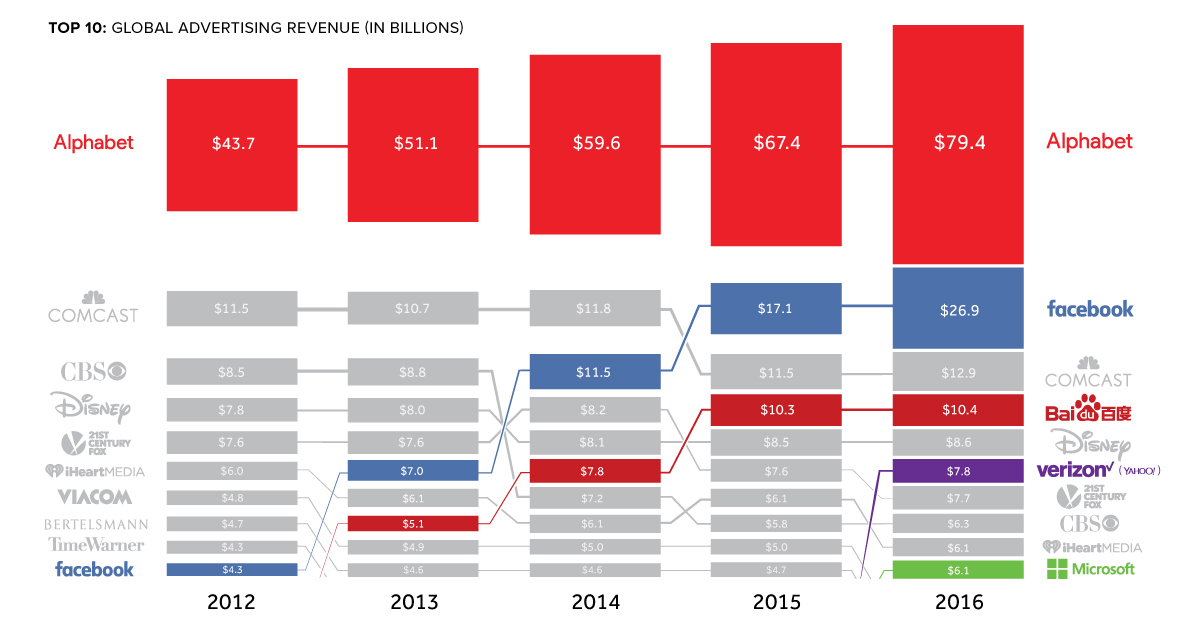
Traditional media is having a tough time keeping up, as Google, Facebook, and Chinese search giant Baidu lead the tech takeover of advertising.
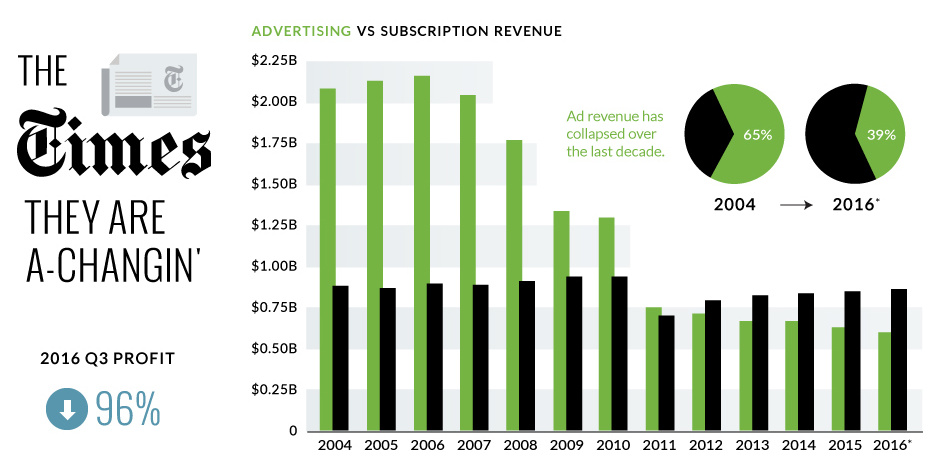
The New York Times just announced a 95.7% decrease in quarterly profits - we look at the numbers and context around the NYT's digital transition.
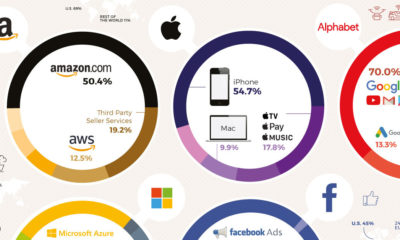
The big five tech companies generate almost $900 billion in revenues combined, more than the GDP of four of the G20 nations. Here's how they earn...
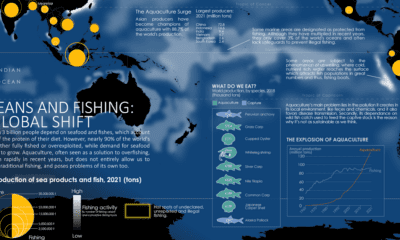
Where do our fish come from? This map charts ocean fishing activity and the amount of fish coming from aquaculture.
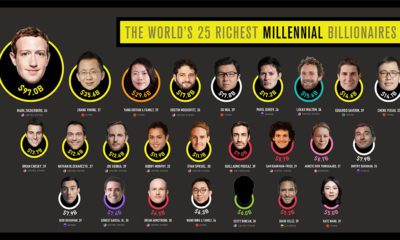
There are over 2,700 billionaires in the world, but how many are millennials? This visual breaks down the richest millennial billionaires.
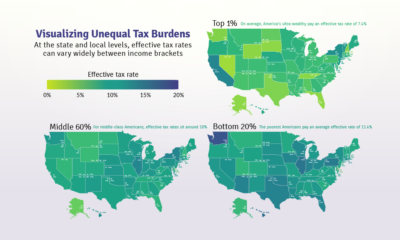
Poor families pay a higher share of their income towards state and local taxes than wealthy families. These maps show the inequitable tax burdens.
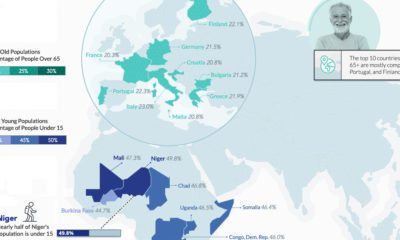
Higher life expectancies and lower fertility rates are reshaping global demographics, but vast regional differences remain. Where are the youngest and oldest countries in the world?
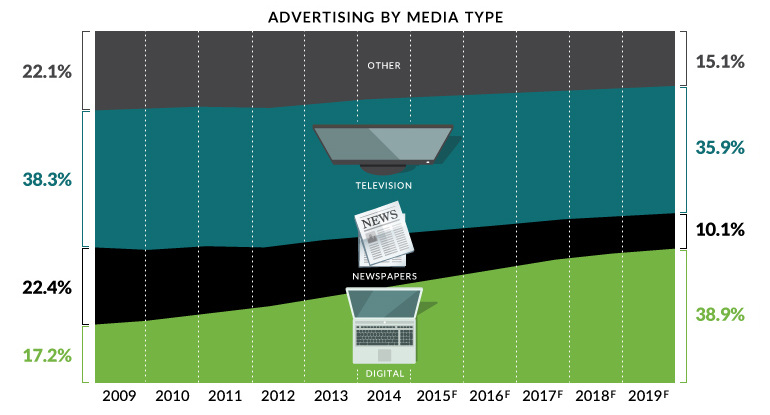
Digital media will be the largest advertising channel globally by 2019 - even bigger than television. This chart covers the death of traditional media.
Just four economies around the world had inflation below 2% in 2022. We show the countries with the lowest inflation globally.
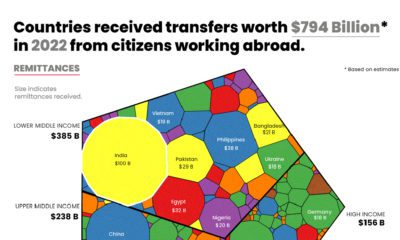
Which countries rely on remittance flows the most? This animation shows the amount of remittance income that countries received in 2022.


 Creator Program