Mapped: The 10 U.S. States With the Lowest Real GDP Growth
Ranked: The World’s 50 Largest Private Equity Firms
Top 10 Countries Most in Debt to the IMF
Ranked: The Top 6 Economies by Share of Global GDP (1980-2024)
Mapped: Europe’s GDP Per Capita, by Country
Countries With the Highest Rates of Crypto Ownership
Mapped: The Number of AI Startups By Country
All of the Grants Given by the U.S. CHIPS Act
Visualizing AI Patents by Country
How Tech Logos Have Evolved Over Time
Visualizing America’s Average Retirement Savings, by Age
Visualizing the Tax Burden of Every U.S. State
Charted: What Frustrates Americans About the Tax System
Ranked: The Top 20 Countries in Debt to China
Mapped: Countries Where Recreational Cannabis is Legal
Which Countries Have the Highest Infant Mortality Rates?
Life Expectancy by Region (1950-2050F)
What Causes Preventable Child Deaths?
The Cost of an EpiPen in Major Markets
Who’s Building the Most Solar Energy?
Mapped: The Age of Energy Projects in Interconnection Queues, by State
Ranked: The Top 10 EV Battery Manufacturers in 2023
The World’s Biggest Nuclear Energy Producers
The World’s Biggest Oil Producers in 2023
Mapped: The Top Exports in Asian Countries
Mapped: U.S. States By Number of Cities Over 250,000 Residents
Mapped: U.S. Immigrants by Region
The Biggest Salt Producing Countries in 2023
Visualizing Copper Production by Country in 2023
Where the World’s Aluminum is Smelted, by Country
Visualizing Global Gold Production in 2023
How People Get Around in America, Europe, and Asia
The Carbon Footprint of Major Travel Methods
Ranking the Top 15 Countries by Carbon Tax Revenue
Ranked: The Countries With the Most Air Pollution in 2023
Top Countries By Forest Growth Since 2001
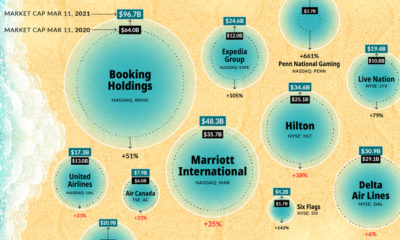
BEACH stocks—bookings, entertainment, airlines, cruises, and hotels—were pulverized at the beginning of the pandemic. Here's how they've bounced back.
This graphic compares the cost of living and purchasing power of 578 cities worldwide, using New York City as a benchmark for comparison.
What does a road map of the world look like? Here’s a deep view of roads visualized by type across countries and continents.
This graphic explores 20 years of Nintendo console sales and the success of the Nintendo Switch.
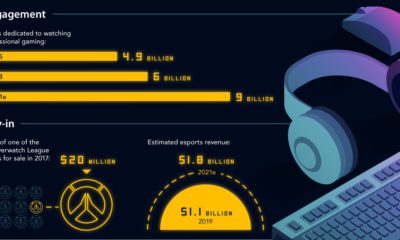
This infographic plots the journey of esports, from underground niche to a billion-dollar mainstream phenomenon—and it shows no signs of slowing down.
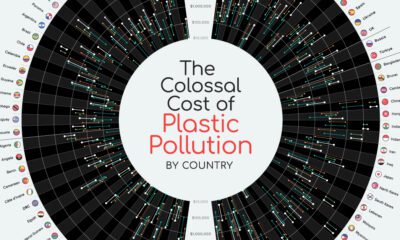
The environmental impact of the combined 139M tons of plastic pollution in oceans and rivers is well known, but what about the economic cost?
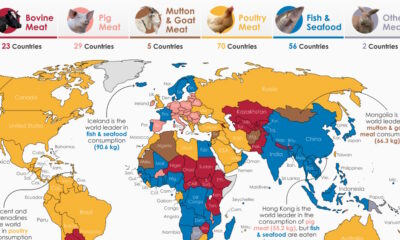
By examining meat consumption by country, we uncover regional differences in how much, and what type of meat people around the world prefer.
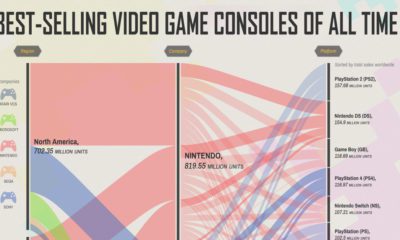
Video game consoles have changed drastically over the last 50 years. Here are some of the best-selling ones across the globe.
AI and edge computing are some of the factors behind the stunning growth of the GPU cloud computing market, predicted to hit $25.5B by 2030.
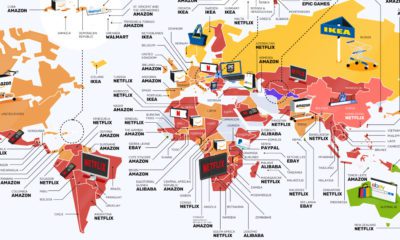
From Netflix to IKEA, this map of the world highlights the most searched for consumer brands around the world.


 Creator Program