Mapped: The 10 U.S. States With the Lowest Real GDP Growth
Ranked: The World’s 50 Largest Private Equity Firms
Top 10 Countries Most in Debt to the IMF
Ranked: The Top 6 Economies by Share of Global GDP (1980-2024)
Mapped: Europe’s GDP Per Capita, by Country
Visualizing the 5 Most Common Cybersecurity Mistakes
Countries With the Highest Rates of Crypto Ownership
Mapped: The Number of AI Startups By Country
All of the Grants Given by the U.S. CHIPS Act
Visualizing AI Patents by Country
Visualizing America’s Average Retirement Savings, by Age
Visualizing the Tax Burden of Every U.S. State
Charted: What Frustrates Americans About the Tax System
Ranked: The Top 20 Countries in Debt to China
Mapped: Countries Where Recreational Cannabis is Legal
Which Countries Have the Highest Infant Mortality Rates?
Life Expectancy by Region (1950-2050F)
What Causes Preventable Child Deaths?
The Cost of an EpiPen in Major Markets
Who’s Building the Most Solar Energy?
Mapped: The Age of Energy Projects in Interconnection Queues, by State
Ranked: The Top 10 EV Battery Manufacturers in 2023
The World’s Biggest Nuclear Energy Producers
The World’s Biggest Oil Producers in 2023
Mapped: The Top Export in Each EU Country
Mapped: The Top Exports in Asian Countries
Mapped: U.S. States By Number of Cities Over 250,000 Residents
The Biggest Salt Producing Countries in 2023
Visualizing Copper Production by Country in 2023
Where the World’s Aluminum is Smelted, by Country
Visualizing Global Gold Production in 2023
How People Get Around in America, Europe, and Asia
The Carbon Footprint of Major Travel Methods
Ranking the Top 15 Countries by Carbon Tax Revenue
Ranked: The Countries With the Most Air Pollution in 2023
Top Countries By Forest Growth Since 2001
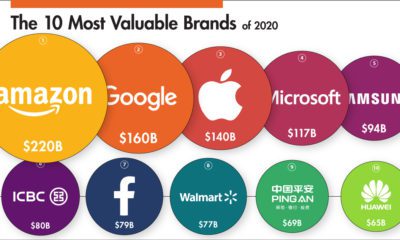
This infographic ranks some of the world’s biggest companies by brand value in 2020 and visualizes the movers and shakers over the past year.
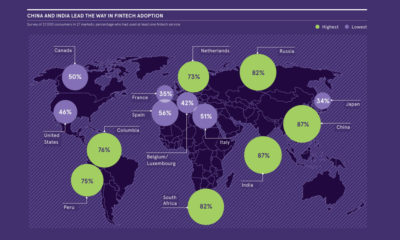
The fintech industry welcomed multi-billion dollar investments in 2019. Where is the most growth, and how are incumbents dealing with digital disruption?
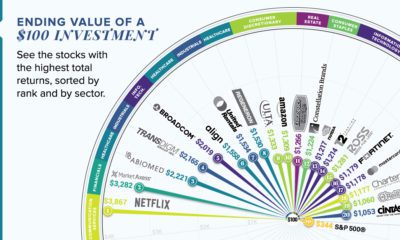
This graphic reveals the best-performing stocks over the last 10 years, and shows how much an initial $100 investment would be worth today.
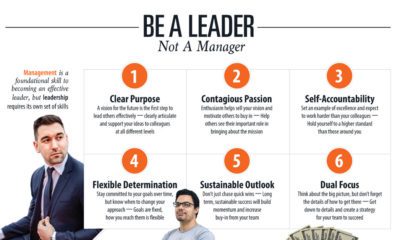
This infographic delves into what it takes to become an effective leader, and how those qualities can impact a company—beyond employee satisfaction.
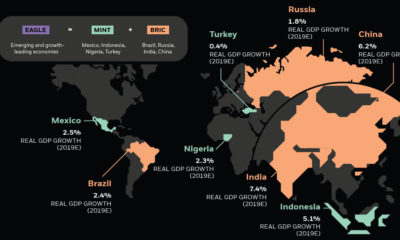
Emerging markets are ascending on the global stage and wielding more economic power—and it's drastically altering the investment landscape.
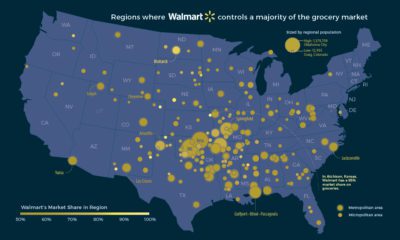
If you want to buy groceries, in some places Walmart is the only game in town. Here's a look at Walmart's domination of the U.S. grocery...
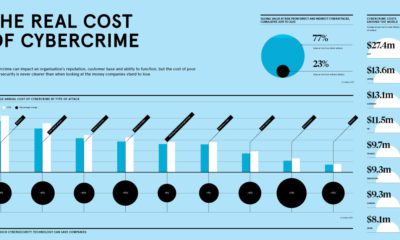
In recent years, cybercrime has become a top concern for organizations around the world. How much do these cyberattacks cost companies annually?
This infographic highlights some of the most promising nanotechnology breakthroughs in medicine, from 'smart pills' to targeted cancer treatment.
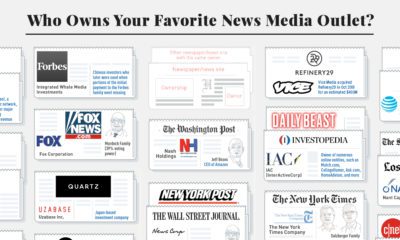
A revealing look at consolidation and ownership of news media outlets in the United States. See who owns news media, and where 'news deserts' exist.
This infographic explores how China’s proposed social credit system will monitor and surveil citizens, and how it'll be used to reward or punish them.