Technology
Visualizing the Massive Cost of Cybercrime
View the full-size version of this infographic.
Visualizing the Massive Cost of Cybercrime
View the high resolution of this infographic by clicking here.
What do Equifax, Yahoo, and the U.S. military have in common? They’ve all fallen victim to a cyberattack at some point in the last decade—and they’re just the tip of the iceberg.
Today’s infographic from Raconteur delves into the average damage caused by cyberattacks at the organizational level, sorted by type of attack, industry, and country.
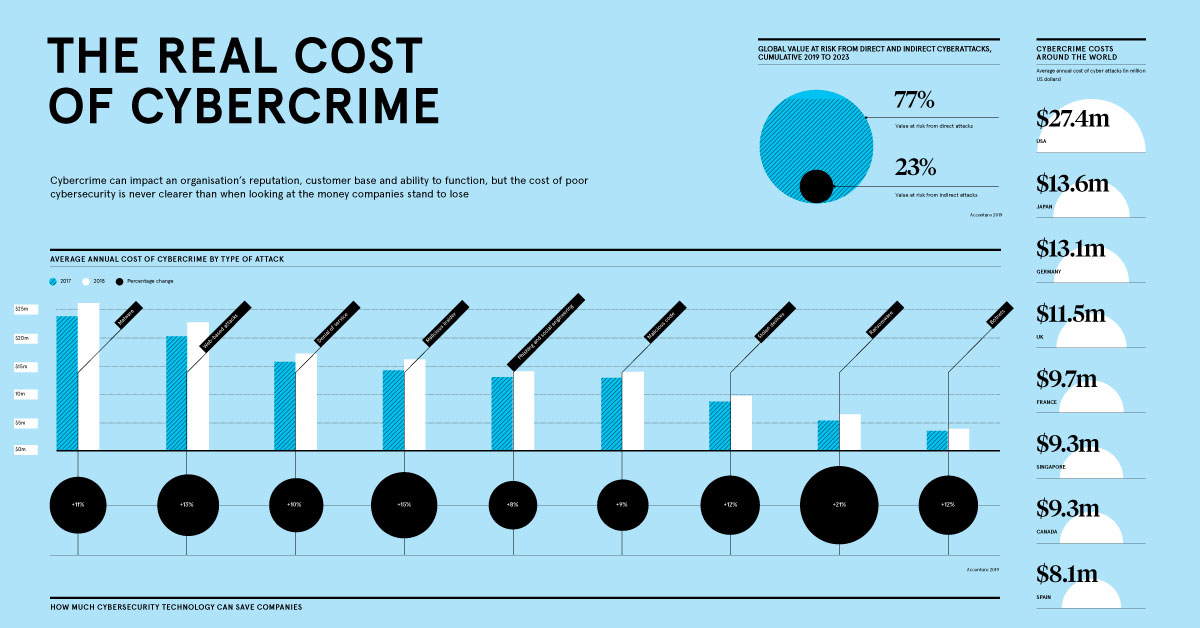
Rising Cybercrime Costs Across the Board
The infographic focuses on data from the latest Accenture “Cost of Cybercrime” study, which details how cyber threats are evolving in a fast-paced digital landscape.
Overall, the average annual cost to organizations has been ballooning for all types of cyberattacks. For example, a single malware attack in 2018 costed more than $2.6 million, while ransomware costs rose the most between 2017–2018, from $533,000 to $646,000 (a 21% increase).
Both information loss and business disruption occurring from attacks have been found to be the major cost drivers, regardless of the type of attack:
- Malware
Major consequence: Information Loss
Average cost: $1.4M (54% of total losses) - Web-based attacks
Major consequence: Information Loss
Average cost: $1.4M (61% of total losses) - Denial-of-Service (DOS)
Major consequence: Business Disruption
Average cost: $1.1M (65% of total losses) - Malicious insiders
Major consequences: Business Disruption and Information Loss
Average cost: $1.2M ($0.6M each, 75% of total losses)
In 2018, information loss and business disruption combined for over 75% of total business losses from cybercrime.
Cybercrime Casts a Wide Net
No industry is untouched by the growing cost of cybercrime—the report notes that organizations have seen security breaches grow by 67% in the past five years alone. Banking is the most affected, with annual costs crossing $18 million in 2018. This probably comes as no surprise, considering that financial motives are consistently a major incentive for hackers.
Here is the average cost of cyberattacks (per organization) across 15 different industries:
| Industry | 2017 Cost | 2018 Cost | % Change |
|---|---|---|---|
| Banking | $16.6M | $18.4M | +11% |
| Utilities | $15.1M | $17.8M | +18% |
| Software | $14.5M | $16M | +11% |
| Automotive | $10.7M | $15.8M | +47% |
| Insurance | $12.9M | $15.8M | +22% |
| High tech | $12.9M | $14.7M | +14% |
| Capital markets | $10.6M | $13.9M | +32% |
| Energy | $13.2M | $13.8M | +4% |
| U.S. Federal | $10.4M | $13.7M | +32% |
| Consumer goods | $8.1M | $11.9M | +47% |
| Health | $12.9M | $11.8M | -8% |
| Retail | $9M | $11.4M | +26% |
| Life sciences | $5.9M | $10.9M | +86% |
| Media | $7.6M | $9.2M | +22% |
| Travel | $4.6M | $8.2M | +77% |
| Public sector | $6.6M | $7.9M | +20% |
Interestingly, the impact on life sciences companies rose the most in a year (up by 86% to $10.9 million per organization), followed by the travel industry (up 77% to $8.2 million per organization). This is likely due to an increase in sensitive and valuable data being shared online, such as clinical trial details or credit card information.
So What Can Companies Do?
Accenture analyzed nine cutting-edge technologies that are helping mitigate cybercrime, and calculated their net savings: the total potential savings minus the required investment in each type of technology or tool.
With almost $2.3 million in net savings, many companies recognize the high payoff that comes with security intelligence. On the other hand, leveraging automation, artificial intelligence, and machine learning can potentially save over $2 million—however, only 38% of businesses have adopted this solution so far.
Cybercrime will remain a large-scale concern for years to come. From 2019–2023E, approximately $5.2 trillion in global value will be at risk from cyberattacks, creating an ongoing challenge for corporations and investors alike.


Technology
Ranked: Semiconductor Companies by Industry Revenue Share
Nvidia is coming for Intel’s crown. Samsung is losing ground. AI is transforming the space. We break down revenue for semiconductor companies.


Semiconductor Companies by Industry Revenue Share
This was originally posted on our Voronoi app. Download the app for free on Apple or Android and discover incredible data-driven charts from a variety of trusted sources.
Did you know that some computer chips are now retailing for the price of a new BMW?
As computers invade nearly every sphere of life, so too have the chips that power them, raising the revenues of the businesses dedicated to designing them.
But how did various chipmakers measure against each other last year?
We rank the biggest semiconductor companies by their percentage share of the industry’s revenues in 2023, using data from Omdia research.
Which Chip Company Made the Most Money in 2023?
Market leader and industry-defining veteran Intel still holds the crown for the most revenue in the sector, crossing $50 billion in 2023, or 10% of the broader industry’s topline.
All is not well at Intel, however, with the company’s stock price down over 20% year-to-date after it revealed billion-dollar losses in its foundry business.
| Rank | Company | 2023 Revenue | % of Industry Revenue |
|---|---|---|---|
| 1 | Intel | $51B | 9.4% |
| 2 | NVIDIA | $49B | 9.0% |
| 3 | Samsung Electronics | $44B | 8.1% |
| 4 | Qualcomm | $31B | 5.7% |
| 5 | Broadcom | $28B | 5.2% |
| 6 | SK Hynix | $24B | 4.4% |
| 7 | AMD | $22B | 4.1% |
| 8 | Apple | $19B | 3.4% |
| 9 | Infineon Tech | $17B | 3.2% |
| 10 | STMicroelectronics | $17B | 3.2% |
| 11 | Texas Instruments | $17B | 3.1% |
| 12 | Micron Technology | $16B | 2.9% |
| 13 | MediaTek | $14B | 2.6% |
| 14 | NXP | $13B | 2.4% |
| 15 | Analog Devices | $12B | 2.2% |
| 16 | Renesas Electronics Corporation | $11B | 1.9% |
| 17 | Sony Semiconductor Solutions Corporation | $10B | 1.9% |
| 18 | Microchip Technology | $8B | 1.5% |
| 19 | Onsemi | $8B | 1.4% |
| 20 | KIOXIA Corporation | $7B | 1.3% |
| N/A | Others | $126B | 23.2% |
| N/A | Total | $545B | 100% |
Note: Figures are rounded. Totals and percentages may not sum to 100.
Meanwhile, Nvidia is very close to overtaking Intel, after declaring $49 billion of topline revenue for 2023. This is more than double its 2022 revenue ($21 billion), increasing its share of industry revenues to 9%.
Nvidia’s meteoric rise has gotten a huge thumbs-up from investors. It became a trillion dollar stock last year, and broke the single-day gain record for market capitalization this year.
Other chipmakers haven’t been as successful. Out of the top 20 semiconductor companies by revenue, 12 did not match their 2022 revenues, including big names like Intel, Samsung, and AMD.
The Many Different Types of Chipmakers
All of these companies may belong to the same industry, but they don’t focus on the same niche.
According to Investopedia, there are four major types of chips, depending on their functionality: microprocessors, memory chips, standard chips, and complex systems on a chip.
Nvidia’s core business was once GPUs for computers (graphics processing units), but in recent years this has drastically shifted towards microprocessors for analytics and AI.
These specialized chips seem to be where the majority of growth is occurring within the sector. For example, companies that are largely in the memory segment—Samsung, SK Hynix, and Micron Technology—saw peak revenues in the mid-2010s.

-

 Real Estate2 weeks ago
Visualizing America’s Shortage of Affordable Homes
-

 Technology1 week ago
Ranked: Semiconductor Companies by Industry Revenue Share
-

 Money2 weeks ago
Which States Have the Highest Minimum Wage in America?
-

 Real Estate2 weeks ago
Ranked: The Most Valuable Housing Markets in America
-

 Business2 weeks ago
Charted: Big Four Market Share by S&P 500 Audits
-

 AI2 weeks ago
The Stock Performance of U.S. Chipmakers So Far in 2024
-

 Misc2 weeks ago
Almost Every EV Stock is Down After Q1 2024
-

 Money2 weeks ago
Where Does One U.S. Tax Dollar Go?