The World’s Top Retail Companies, by Domestic Revenue
Ten Classic American Brands Owned by Foreign Companies
Ranked: U.S. Cities with the Highest Rent in 2024
Mapped: Where Tesla and BYD Make Their Cars
Ranked: The Countries Most Dependent on Agricultural Exports
What is the Median Pay of Magnificent Seven Companies?
Visualizing the 15 Most Valuable Bitcoin Addresses
Charted: How Many Data Centers do Major Big Tech Companies Have?
Visualizing the Training Costs of AI Models Over Time
Visualizing the Top Countries, by Mobile Data Usage
Mapped: The Income Needed to Live Comfortably in Every U.S. State
Charted: America’s Shift to a Cashless Society
Mapped: The Income a Family Needs to Live Comfortably in Every U.S. State
Top 10 Countries Most in Debt to the IMF
Which Countries Have Universal Health Coverage?
Visualizing Daily Protein Sources by Region
Mapped: Countries Where Recreational Cannabis is Legal
Which Countries Have the Highest Infant Mortality Rates?
Life Expectancy by Region (1950-2050F)
Comparing Saudi Aramco’s $1.9T Valuation to Its Rivals
Ranked: The World’s Largest Lithium Producers in 2023
Who’s Building the Most Solar Energy?
Mapped: The Age of Energy Projects in Interconnection Queues, by State
Ranked: The Top 10 EV Battery Manufacturers in 2023
Mapped: The 10 Hottest and Coldest Countries in the World
Map: The World’s Oldest and Youngest Countries, by Median Age
Ranked: Countries with the Most Embassies Around the World
Visualizing Raw Steel Production in 2023
Visualizing Cobalt Production by Country in 2023
The Biggest Salt Producing Countries in 2023
Visualizing Copper Production by Country in 2023
Ranked: Top 20 Countries by Plastic Waste per Capita
How People Get Around in America, Europe, and Asia
The Carbon Footprint of Major Travel Methods
Ranking the Top 15 Countries by Carbon Tax Revenue
Ranked: The Countries With the Most Air Pollution in 2023
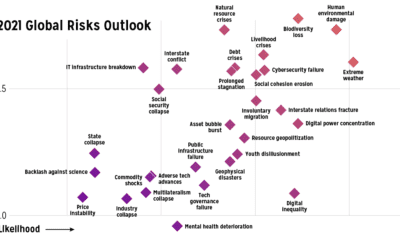
Which risks are top of mind in 2021? We visualize the World Economic Forum's risk assessment for top global risks by impact and livelihood.
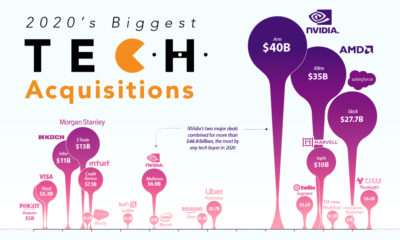
In a challenging year for most, many large tech companies have prospered and grown. We visualize the year’s biggest tech mergers and acquisitions.
In some cases, COVID-19 has sped up societal and economic trends that were already in motion. Here we examine five examples.
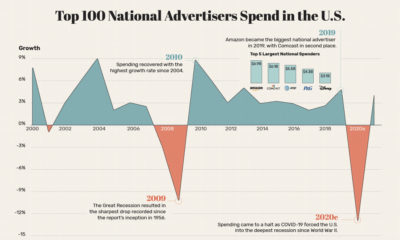
This graphic visualizes the fluctuations in advertising spend in the U.S., along with its brutal decline of 13% as a result of COVID-19.
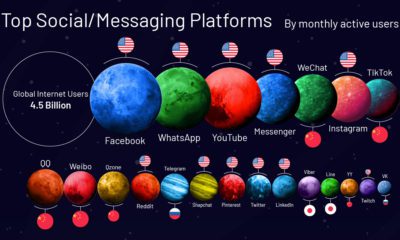
Nearly half the world has tapped into the social media universe. Monthly Active Users (MAUs) quantifies the success of these giant platforms.
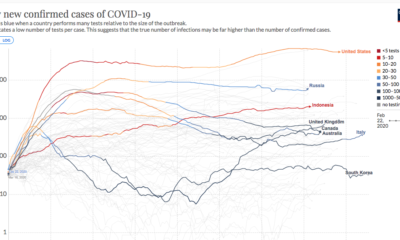
This continuously updated chart provides a more complete look at the efficacy of COVID-19 containment strategies.
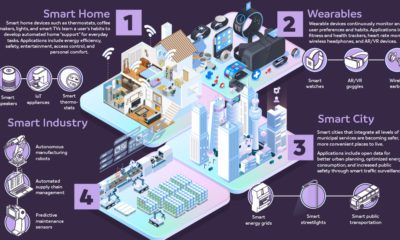
AI is emerging as a driving technology behind the internet of things (IoT). Learn about the new AIoT, and how it will impact the future.
Which countries are turning to nuclear energy, and which are turning away? Mapping and breaking down the world’s nuclear reactor landscape.
Tech giants and e-commerce brands are thriving—and running circles around less pandemic-proof brands.
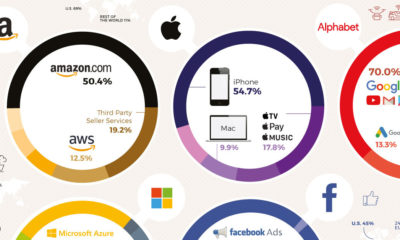
The big five tech companies generate almost $900 billion in revenues combined, more than the GDP of four of the G20 nations. Here's how they earn...