Mapped: The 10 U.S. States With the Lowest Real GDP Growth
Ranked: The World’s 50 Largest Private Equity Firms
Top 10 Countries Most in Debt to the IMF
Ranked: The Top 6 Economies by Share of Global GDP (1980-2024)
Mapped: Europe’s GDP Per Capita, by Country
Visualizing the 5 Most Common Cybersecurity Mistakes
Countries With the Highest Rates of Crypto Ownership
Mapped: The Number of AI Startups By Country
All of the Grants Given by the U.S. CHIPS Act
Visualizing AI Patents by Country
Visualizing America’s Average Retirement Savings, by Age
Visualizing the Tax Burden of Every U.S. State
Charted: What Frustrates Americans About the Tax System
Ranked: The Top 20 Countries in Debt to China
Mapped: Countries Where Recreational Cannabis is Legal
Which Countries Have the Highest Infant Mortality Rates?
Life Expectancy by Region (1950-2050F)
What Causes Preventable Child Deaths?
The Cost of an EpiPen in Major Markets
Who’s Building the Most Solar Energy?
Mapped: The Age of Energy Projects in Interconnection Queues, by State
Ranked: The Top 10 EV Battery Manufacturers in 2023
The World’s Biggest Nuclear Energy Producers
The World’s Biggest Oil Producers in 2023
Mapped: The Top Exports in Asian Countries
Mapped: U.S. States By Number of Cities Over 250,000 Residents
Mapped: U.S. Immigrants by Region
The Biggest Salt Producing Countries in 2023
Visualizing Copper Production by Country in 2023
Where the World’s Aluminum is Smelted, by Country
Visualizing Global Gold Production in 2023
How People Get Around in America, Europe, and Asia
The Carbon Footprint of Major Travel Methods
Ranking the Top 15 Countries by Carbon Tax Revenue
Ranked: The Countries With the Most Air Pollution in 2023
Top Countries By Forest Growth Since 2001
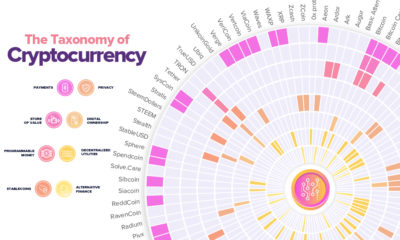
Cryptocurrencies have evolved past digital cash. This graphic explores the the new cryptocurrency ecosystem and how it's impacting the modern economy.
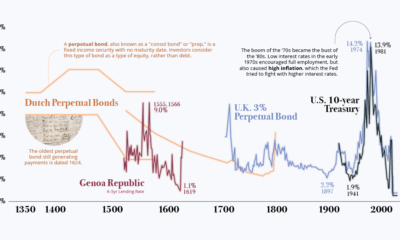
Interest rates sit near generational lows — is this the new normal, or has it been the trend all along? We show a history of interest...
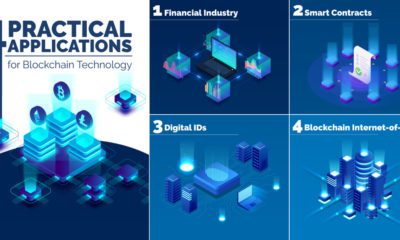
Blockchain technology is no longer a fringe innovation. Here's how it is being used in increasingly practical ways, from elections to entertainment.
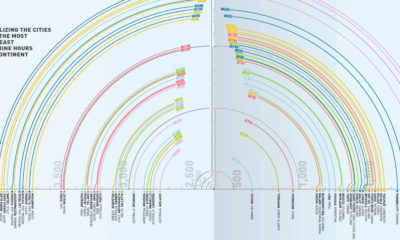
While we all see the same sky, some see it differently, depending on where they live. Today's graphic ranks world cities by annual hours of sunshine.
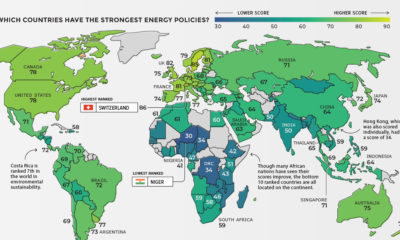
Which countries are able to balance prosperity and sustainability in their energy mixes? See the countries with the most sustainable energy policies.
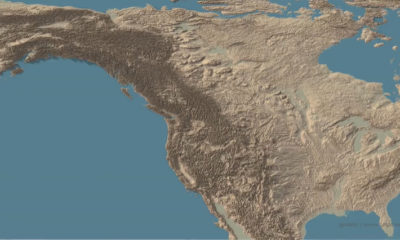
This stunning set of 3d maps purposefully exaggerate the elevation scale to show you the mountains of both the United States and North America.
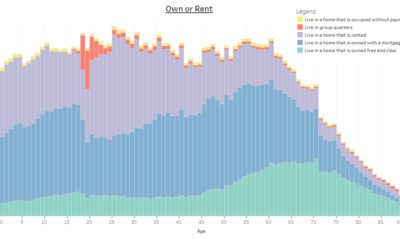
This interactive infographic allows you sort data on the U.S. population using a variety of topics, to see how Americans differ by age.
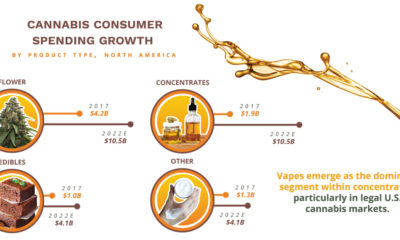
Cannabis consumers could spend up to $10.5B on concentrates by 2022—and they’re increasingly relying on the influence of branding to make their choices.
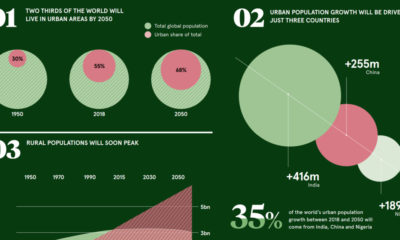
These pivotal trends show how urban demographics are aiding in the transition to a very different economic and investment landscape.
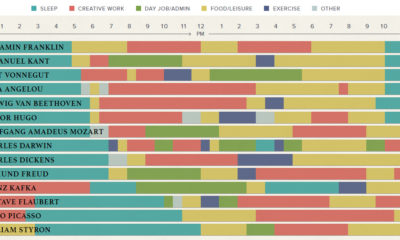
The eclectic daily routines that inspired the world's most famous creative people to produce their best and most original work.