Mapped: The 10 U.S. States With the Lowest Real GDP Growth
Ranked: The World’s 50 Largest Private Equity Firms
Top 10 Countries Most in Debt to the IMF
Ranked: The Top 6 Economies by Share of Global GDP (1980-2024)
Mapped: Europe’s GDP Per Capita, by Country
Countries With the Highest Rates of Crypto Ownership
Mapped: The Number of AI Startups By Country
All of the Grants Given by the U.S. CHIPS Act
Visualizing AI Patents by Country
How Tech Logos Have Evolved Over Time
Visualizing America’s Average Retirement Savings, by Age
Visualizing the Tax Burden of Every U.S. State
Charted: What Frustrates Americans About the Tax System
Ranked: The Top 20 Countries in Debt to China
Mapped: Countries Where Recreational Cannabis is Legal
Which Countries Have the Highest Infant Mortality Rates?
Life Expectancy by Region (1950-2050F)
What Causes Preventable Child Deaths?
The Cost of an EpiPen in Major Markets
Who’s Building the Most Solar Energy?
Mapped: The Age of Energy Projects in Interconnection Queues, by State
Ranked: The Top 10 EV Battery Manufacturers in 2023
The World’s Biggest Nuclear Energy Producers
The World’s Biggest Oil Producers in 2023
Mapped: The Top Exports in Asian Countries
Mapped: U.S. States By Number of Cities Over 250,000 Residents
Mapped: U.S. Immigrants by Region
The Biggest Salt Producing Countries in 2023
Visualizing Copper Production by Country in 2023
Where the World’s Aluminum is Smelted, by Country
Visualizing Global Gold Production in 2023
How People Get Around in America, Europe, and Asia
The Carbon Footprint of Major Travel Methods
Ranking the Top 15 Countries by Carbon Tax Revenue
Ranked: The Countries With the Most Air Pollution in 2023
Top Countries By Forest Growth Since 2001
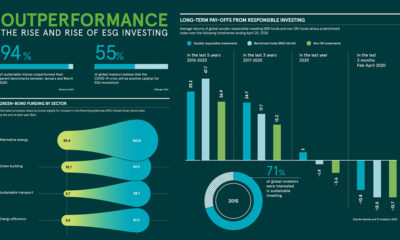
With ESG investing outperforming benchmarks, could green bonds be next in line? We unpack the megatrend taking hold of the financial world.
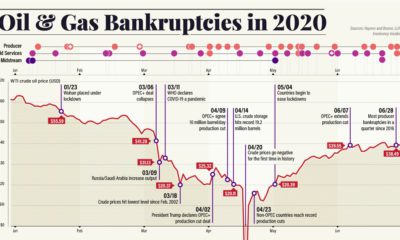
Dropping crude prices and a worsening pandemic have led to a growing wave of energy bankruptcies. Here’s what that fallout looks like.
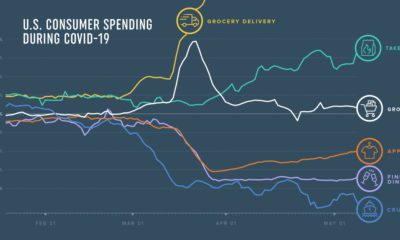
How has COVID-19 transformed consumer spending trends so far? We look at credit and debit card spending of 5 million U.S. consumers across 18 categories.
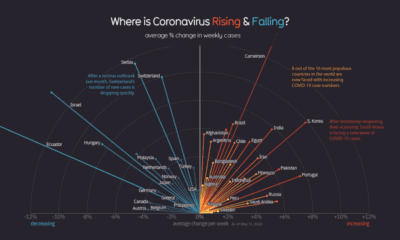
Globally, the curve of COVID-19 cases is flattening, but individual countries vary considerably as new pockets of the world deal with the pandemic.
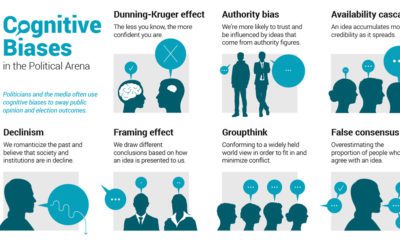
Humans are hardwired to make mental mistakes called cognitive biases. Here are common biases that can shape political opinion, and even elections.
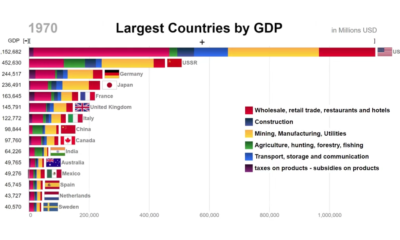
This animation looks at the top countries in the world by GDP, while also showing the components that comprised economic activity at the time.
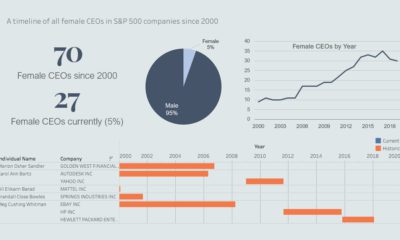
Since the turn of the century, only a meager 5.6% of S&P 500-indexed companies have been led by women. Today's interactive timeline highlights their tenures.
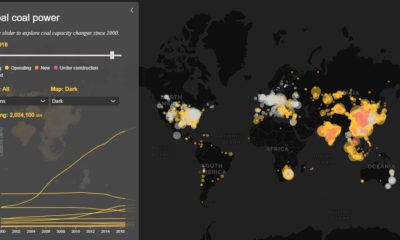
Today’s interactive map shows all of the world's coal power plants, plotted by capacity and carbon emissions from 2000 until 2018.
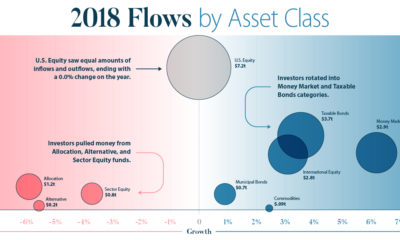
This infographic breaks down investment flows into funds (mutual funds, ETFs, etc.) over the course of 2018 to show how and when investors changed strategies.
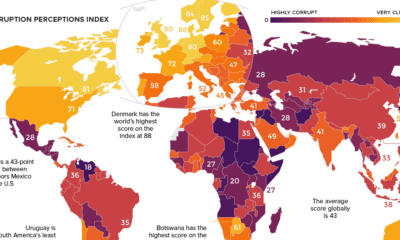
Which countries are the most (and least) corrupt? This world map shows the figures for the Corruption Perceptions Index (CPI) for 2018.