Mapped: The 10 U.S. States With the Lowest Real GDP Growth
Ranked: The World’s 50 Largest Private Equity Firms
Top 10 Countries Most in Debt to the IMF
Ranked: The Top 6 Economies by Share of Global GDP (1980-2024)
Mapped: Europe’s GDP Per Capita, by Country
Countries With the Highest Rates of Crypto Ownership
Mapped: The Number of AI Startups By Country
All of the Grants Given by the U.S. CHIPS Act
Visualizing AI Patents by Country
How Tech Logos Have Evolved Over Time
Visualizing America’s Average Retirement Savings, by Age
Visualizing the Tax Burden of Every U.S. State
Charted: What Frustrates Americans About the Tax System
Ranked: The Top 20 Countries in Debt to China
Mapped: Countries Where Recreational Cannabis is Legal
Which Countries Have the Highest Infant Mortality Rates?
Life Expectancy by Region (1950-2050F)
What Causes Preventable Child Deaths?
The Cost of an EpiPen in Major Markets
Who’s Building the Most Solar Energy?
Mapped: The Age of Energy Projects in Interconnection Queues, by State
Ranked: The Top 10 EV Battery Manufacturers in 2023
The World’s Biggest Nuclear Energy Producers
The World’s Biggest Oil Producers in 2023
Mapped: The Top Exports in Asian Countries
Mapped: U.S. States By Number of Cities Over 250,000 Residents
Mapped: U.S. Immigrants by Region
The Biggest Salt Producing Countries in 2023
Visualizing Copper Production by Country in 2023
Where the World’s Aluminum is Smelted, by Country
Visualizing Global Gold Production in 2023
How People Get Around in America, Europe, and Asia
The Carbon Footprint of Major Travel Methods
Ranking the Top 15 Countries by Carbon Tax Revenue
Ranked: The Countries With the Most Air Pollution in 2023
Top Countries By Forest Growth Since 2001
It’s been a long year since the WHO declared the novel coronavirus a global pandemic. This visual looks at key events in the COVID-19 timeline.
With some esports companies more valuable than traditional sports teams, we visualize esports vs sports in franchise value.
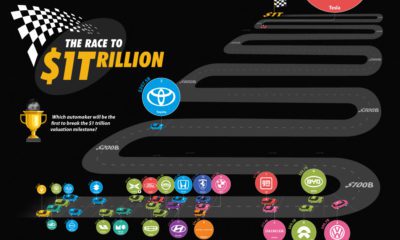
The World’s Top Car Manufacturers by Market Cap View the high-resolution of the infographic by clicking here. Ever since Apple and other Big Tech companies hit...
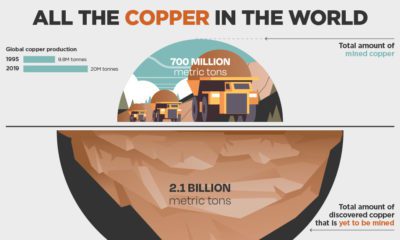
Are we running out of copper? This graphic from Trilogy Metals paints a clear picture of all the copper in the world, above and underground.
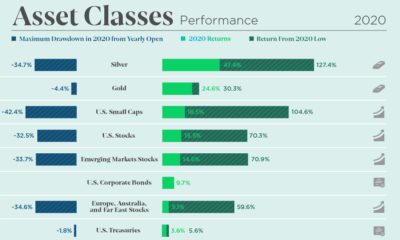
The markets were volatile but offered great opportunity in 2020. See how every asset class, currency, and S&P 500 sector performed over the year.
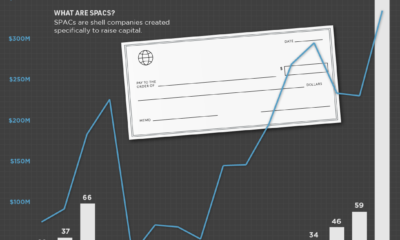
SPACs have raised more capital in 2020 than in the last 10 years combined. Here’s a look at their growth in the last decade.
Podcasting is now a billion dollar industry, attracting big names and audiences to match. Here's a global look at the top podcasts on Spotify.
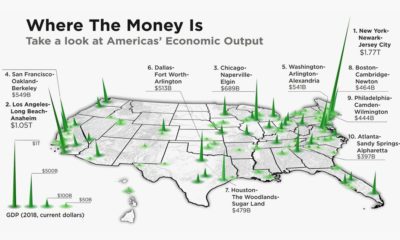
The total U.S. GDP stands at a whopping $21 trillion, but which metro areas contribute to the most in terms of economic output?
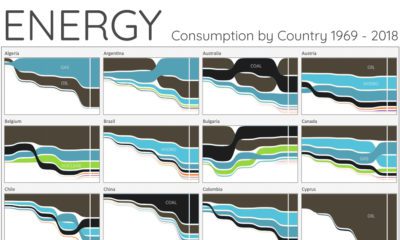
For the last 50 years, fossil fuels have dominated energy consumption. This chart looks at how the energy mix is changing in over 60+ countries.
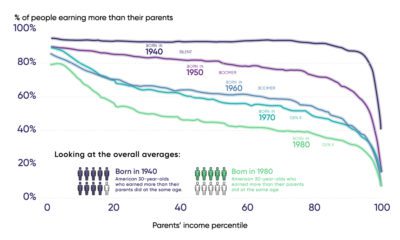
Each generation of Americans has historically earned more than their parents, but declining upward mobility is putting this growth at risk.