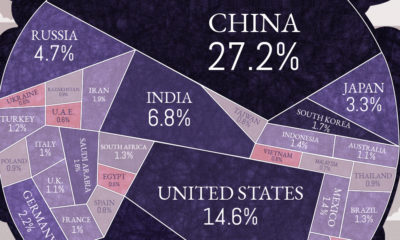

Just 15 countries are responsible for almost three quarters of the world’s carbon emissions. But what does this look like per capita, and over time?
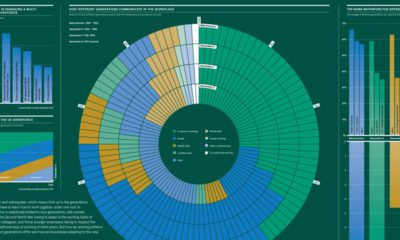

Summing up the differences in how generations approach work, including on topics such as communication, motivation, and employer loyalty.
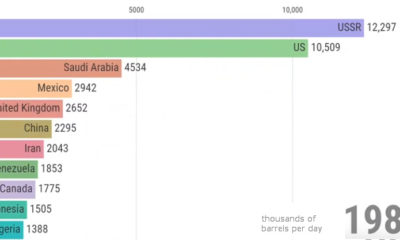

View how the ranking of the world's largest producers of crude oil changes over a 50 year period, from the Cold War until today.


A clean energy transition is underway as wind, solar, and batteries take center stage. Here's how copper plays the critical role in these technologies.


Here are 11 common phrases that managers should avoid saying to their teams, and what they should replace them with to get a better result.
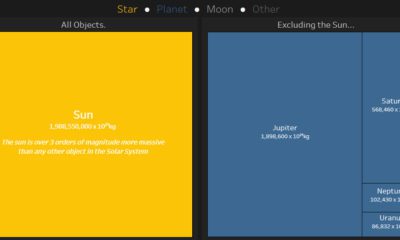

This interactive data visualization illustrates how the different planetary objects in our solar system compare based on their individual masses.
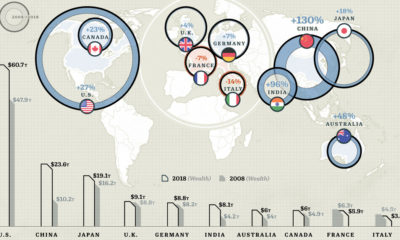

These countries hold 74% of the world's $204 trillion in private wealth. See the 10 richest countries, and how their totals have changed over time.
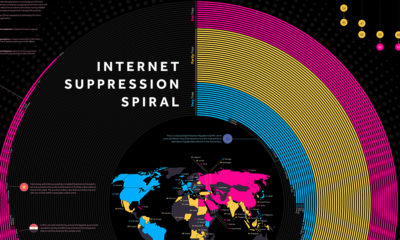

Freedom of speech on the internet has been on decline for eight consecutive years. We visualize the death spiral to show who limits speech the most.
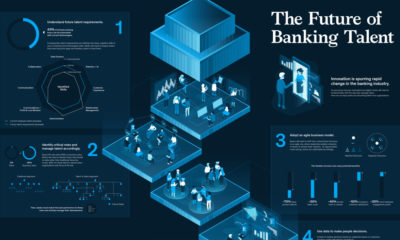

Banking talent is undergoing a fundamental shift. This infographic explores how banks are adapting to rapid automation and digitization in the industry.
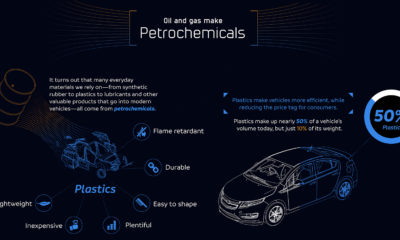

It is counterintuitive, but electric vehicles are not possible without oil - these petrochemicals bring down the weight of cars to make EVs possible.


