Top 10 Countries Most in Debt to the IMF
Ranked: The Top 6 Economies by Share of Global GDP (1980-2024)
Mapped: Europe’s GDP Per Capita, by Country
The Growth of a $1,000 Equity Investment, by Stock Market
Mapped: The Most Valuable Company in Each Southeast Asian Country
Countries With the Highest Rates of Crypto Ownership
Mapped: The Number of AI Startups By Country
All of the Grants Given by the U.S. CHIPS Act
Visualizing AI Patents by Country
How Tech Logos Have Evolved Over Time
Visualizing America’s Average Retirement Savings, by Age
Visualizing the Tax Burden of Every U.S. State
Charted: What Frustrates Americans About the Tax System
Ranked: The Top 20 Countries in Debt to China
Mapped: Countries Where Recreational Cannabis is Legal
Which Countries Have the Highest Infant Mortality Rates?
Life Expectancy by Region (1950-2050F)
What Causes Preventable Child Deaths?
The Cost of an EpiPen in Major Markets
Who’s Building the Most Solar Energy?
Mapped: The Age of Energy Projects in Interconnection Queues, by State
Ranked: The Top 10 EV Battery Manufacturers in 2023
The World’s Biggest Nuclear Energy Producers
The World’s Biggest Oil Producers in 2023
Mapped: The Top Exports in Asian Countries
Mapped: U.S. States By Number of Cities Over 250,000 Residents
Mapped: U.S. Immigrants by Region
Mapped: Southeast Asia’s GDP Per Capita, by Country
The Biggest Salt Producing Countries in 2023
Visualizing Copper Production by Country in 2023
Where the World’s Aluminum is Smelted, by Country
Visualizing Global Gold Production in 2023
How People Get Around in America, Europe, and Asia
The Carbon Footprint of Major Travel Methods
Ranking the Top 15 Countries by Carbon Tax Revenue
Ranked: The Countries With the Most Air Pollution in 2023
Top Countries By Forest Growth Since 2001
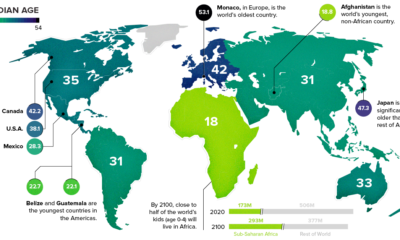
This chart takes a look at the median age of every continent, while also breaking down the youngest and oldest countries in the world.
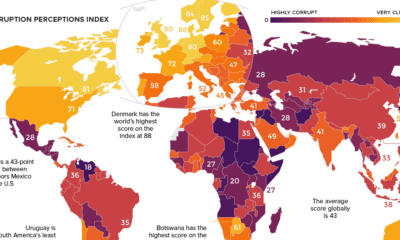
Which countries are the most (and least) corrupt? This world map shows the figures for the Corruption Perceptions Index (CPI) for 2018.
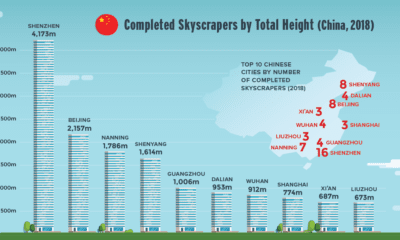
Nearly 150 skyscrapers were completed around the world last year. Find out which cities and regions are growing skyward the fastest.
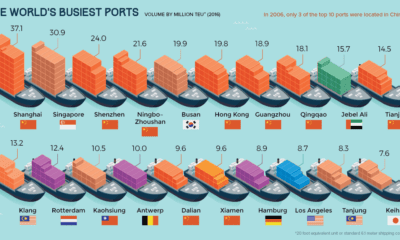
Every day, millions of tons of goods pass through ports to get to their end consumers. Here are the world's busiest ports, and how numbers have...
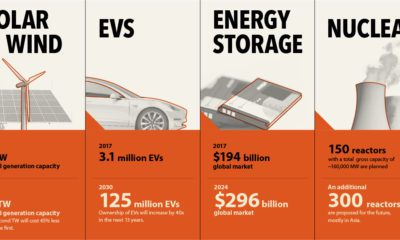
The emergence of the world’s renewable energy sector is setting the stage for a commodity boom - here's the bull case for 12 different metals going...
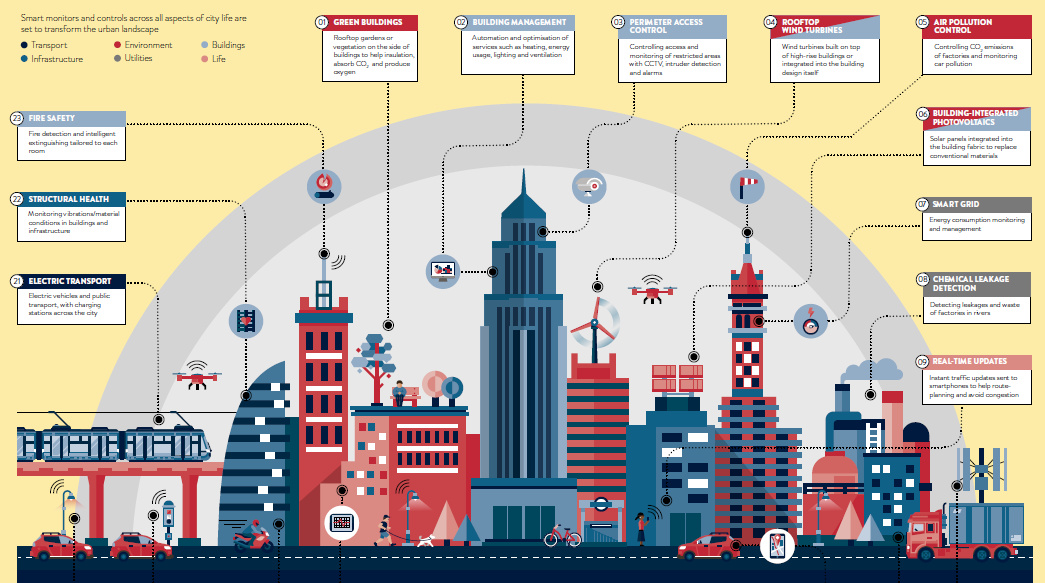
The city will remain the centerpiece of economic growth in the 21st century. Here's how we're using smart city technology to optimize them even further.
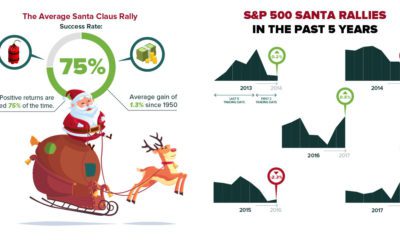
Here's the historical data on the fabled Santa Claus Rally that occurs in the stock market, and how things are shaping up so far this holiday...
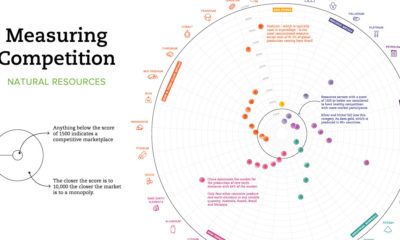
Which resource markets have healthy levels of competition, and which are more monopolistic? This chart shows the global level of competition for 33 minerals.
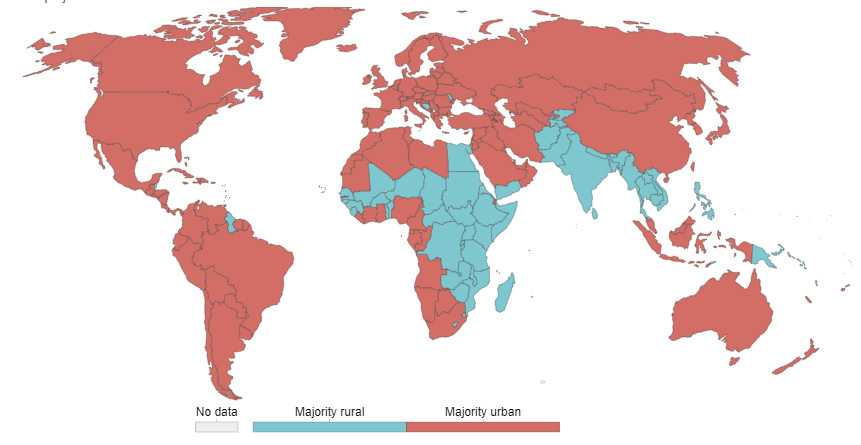
55% of the world lives in urban areas today. But what defines an urban population, and how will this big picture change by 2050?
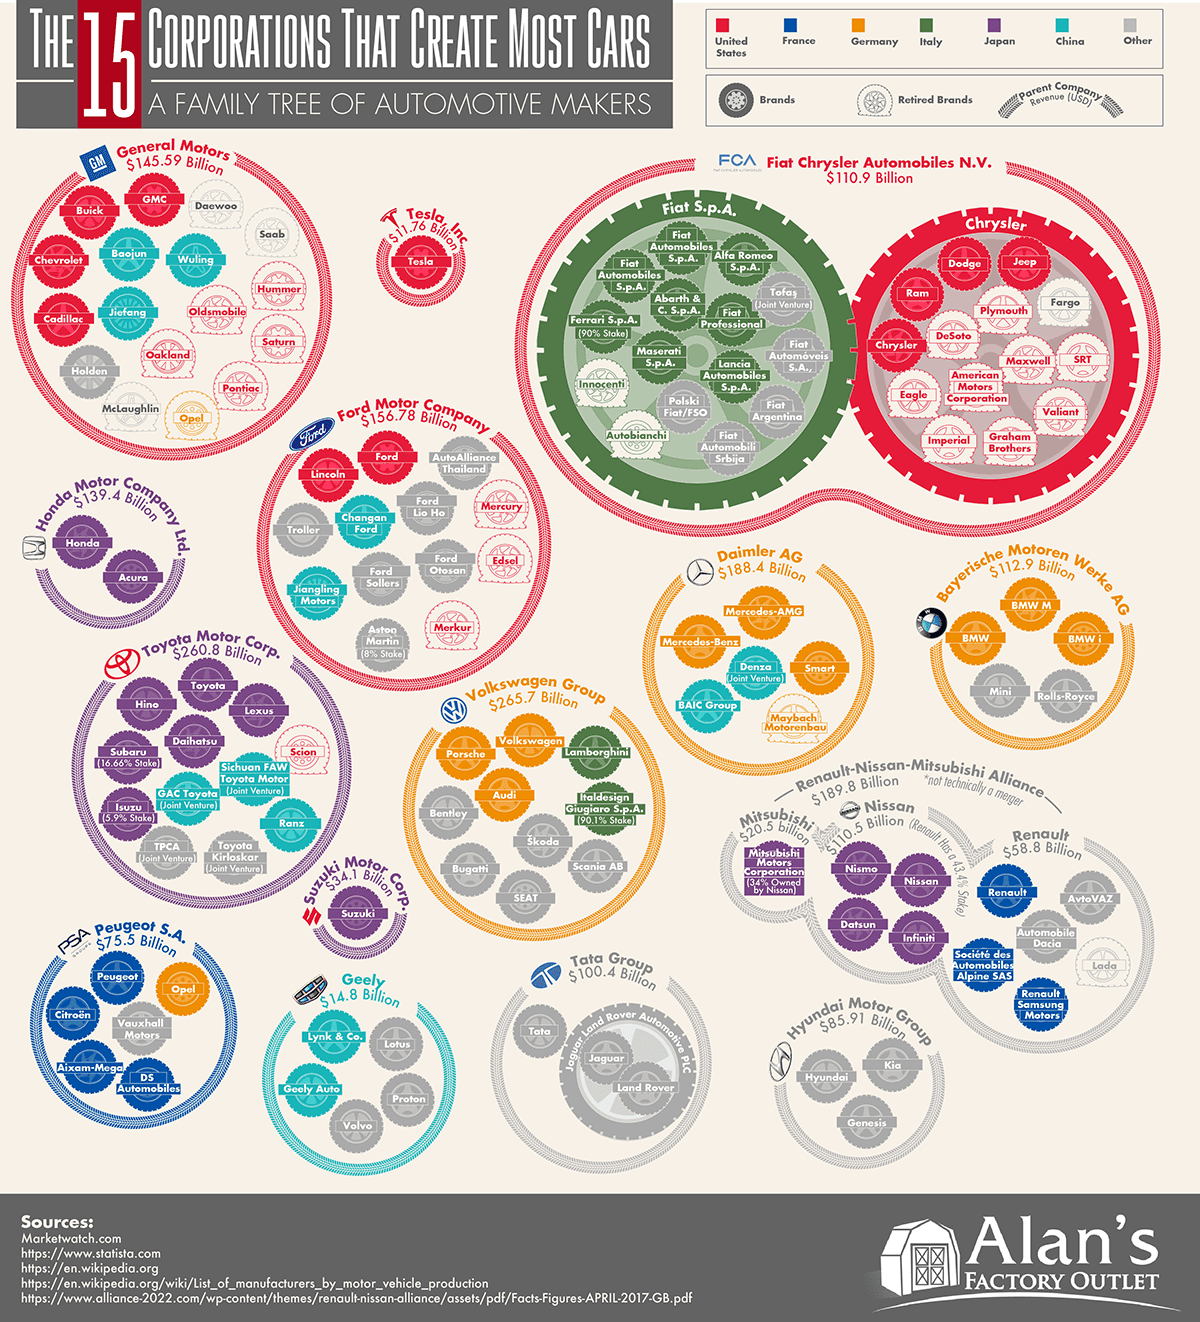
This massive infographic shows the 15 corporations that make the most cars, their annual revenues, and the brands owned by each automaker.