Comparing Saudi Aramco’s $1.9T Valuation to Its Rivals
The Top Retailers in the World, by Store Count
Visualizing Berkshire Hathaway’s Stock Portfolio (Q1 2024)
Nvidia is Worth More Than All of These Companies Combined
Which Retailers Operate in the Most Countries?
What Laptop Brands do Americans Use in 2024?
Ranked: The Top Startup Cities Around the World
Visualizing the 5 Most Common Cybersecurity Mistakes
Countries With the Highest Rates of Crypto Ownership
Mapped: The Income a Family Needs to Live Comfortably in Every U.S. State
Top 10 Countries Most in Debt to the IMF
Visualizing America’s Average Retirement Savings, by Age
Visualizing the Tax Burden of Every U.S. State
Charted: What Frustrates Americans About the Tax System
Visualizing Daily Protein Sources by Region
Mapped: Countries Where Recreational Cannabis is Legal
Which Countries Have the Highest Infant Mortality Rates?
Life Expectancy by Region (1950-2050F)
What Causes Preventable Child Deaths?
Ranked: The World’s Largest Lithium Producers in 2023
Who’s Building the Most Solar Energy?
Mapped: The Age of Energy Projects in Interconnection Queues, by State
Ranked: The Top 10 EV Battery Manufacturers in 2023
Mapped: The World’s Largest Armies in 2024
Mapped: Chinese Provinces With Cities Over 1 Million People
Map: Where Are America’s Largest Landfills?
Mapped: The World’s Wettest and Driest Countries
Visualizing Cobalt Production by Country in 2023
The Biggest Salt Producing Countries in 2023
Visualizing Copper Production by Country in 2023
Where the World’s Aluminum is Smelted, by Country
How People Get Around in America, Europe, and Asia
The Carbon Footprint of Major Travel Methods
Ranking the Top 15 Countries by Carbon Tax Revenue
Ranked: The Countries With the Most Air Pollution in 2023
Top Countries By Forest Growth Since 2001
It's election year around the world, and this map of 2024 global elections by country shows just how many people will be impacted.
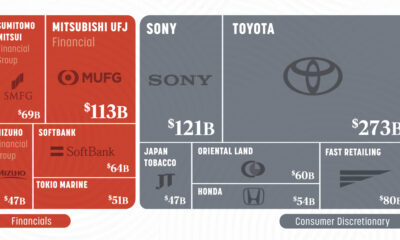
Japan’s top 25 corporations are worth a combined $2 trillion.
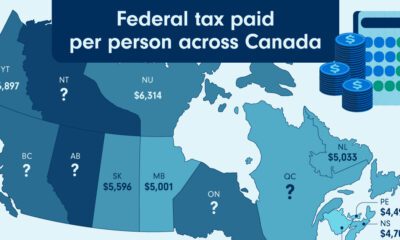
We show which provinces and territories pay the most and least tax after adjusting for the number of tax filers in each jurisdiction.
Wealth distribution in America is becoming increasingly unequal, with the wealth held by the top 0.1% reaching its highest level on record.
This map explores the world’s top 50 science and technology hubs based on the Global Innovation Index 2023 data.
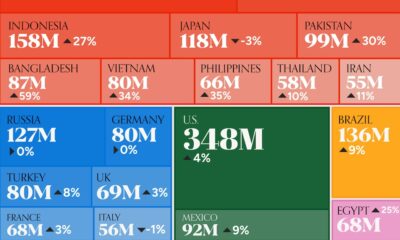
We visualize the 20 largest consumer markets in the world in 2030—from Asian giants to North and South American powerhouses.
Bitcoin returns surged 156% in 2023, marking the end of the crypto winter. Here's how its performance compared to major asset classes.
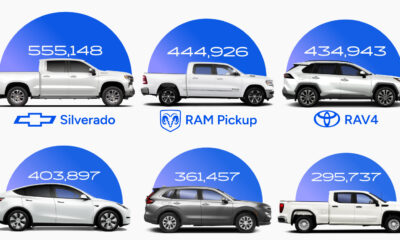
In 2023, nine of the top 10 best-selling vehicles in America were trucks or SUVs. This graphic shows the most popular vehicles overall.
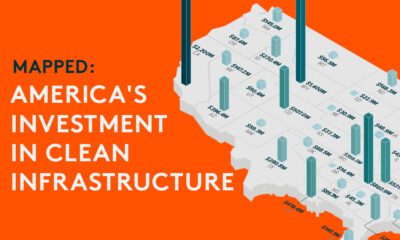
This graphic shows high levels of investment in U.S. clean infrastructure between 2021 and 2023.
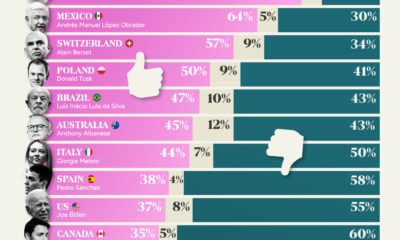
This chart highlights the approval ratings of world leaders in 2024, showing how the citizens of major countries feel about their leaders.